Before I was a writer, I was an artist.
My early sketches were done hunched over the kitchen counter, scribbling furiously on printer paper. Now, I prefer digital tools.
Graphic design lets me use my love for bright colors and bold typography to making news more interactive and accessible. In a digital-first news industry, visuals are everything; graphics reporting and interactive media, I think, are some of the most underutilized yet efficient tools to tell stories.
Download linked files for higher quality:
-
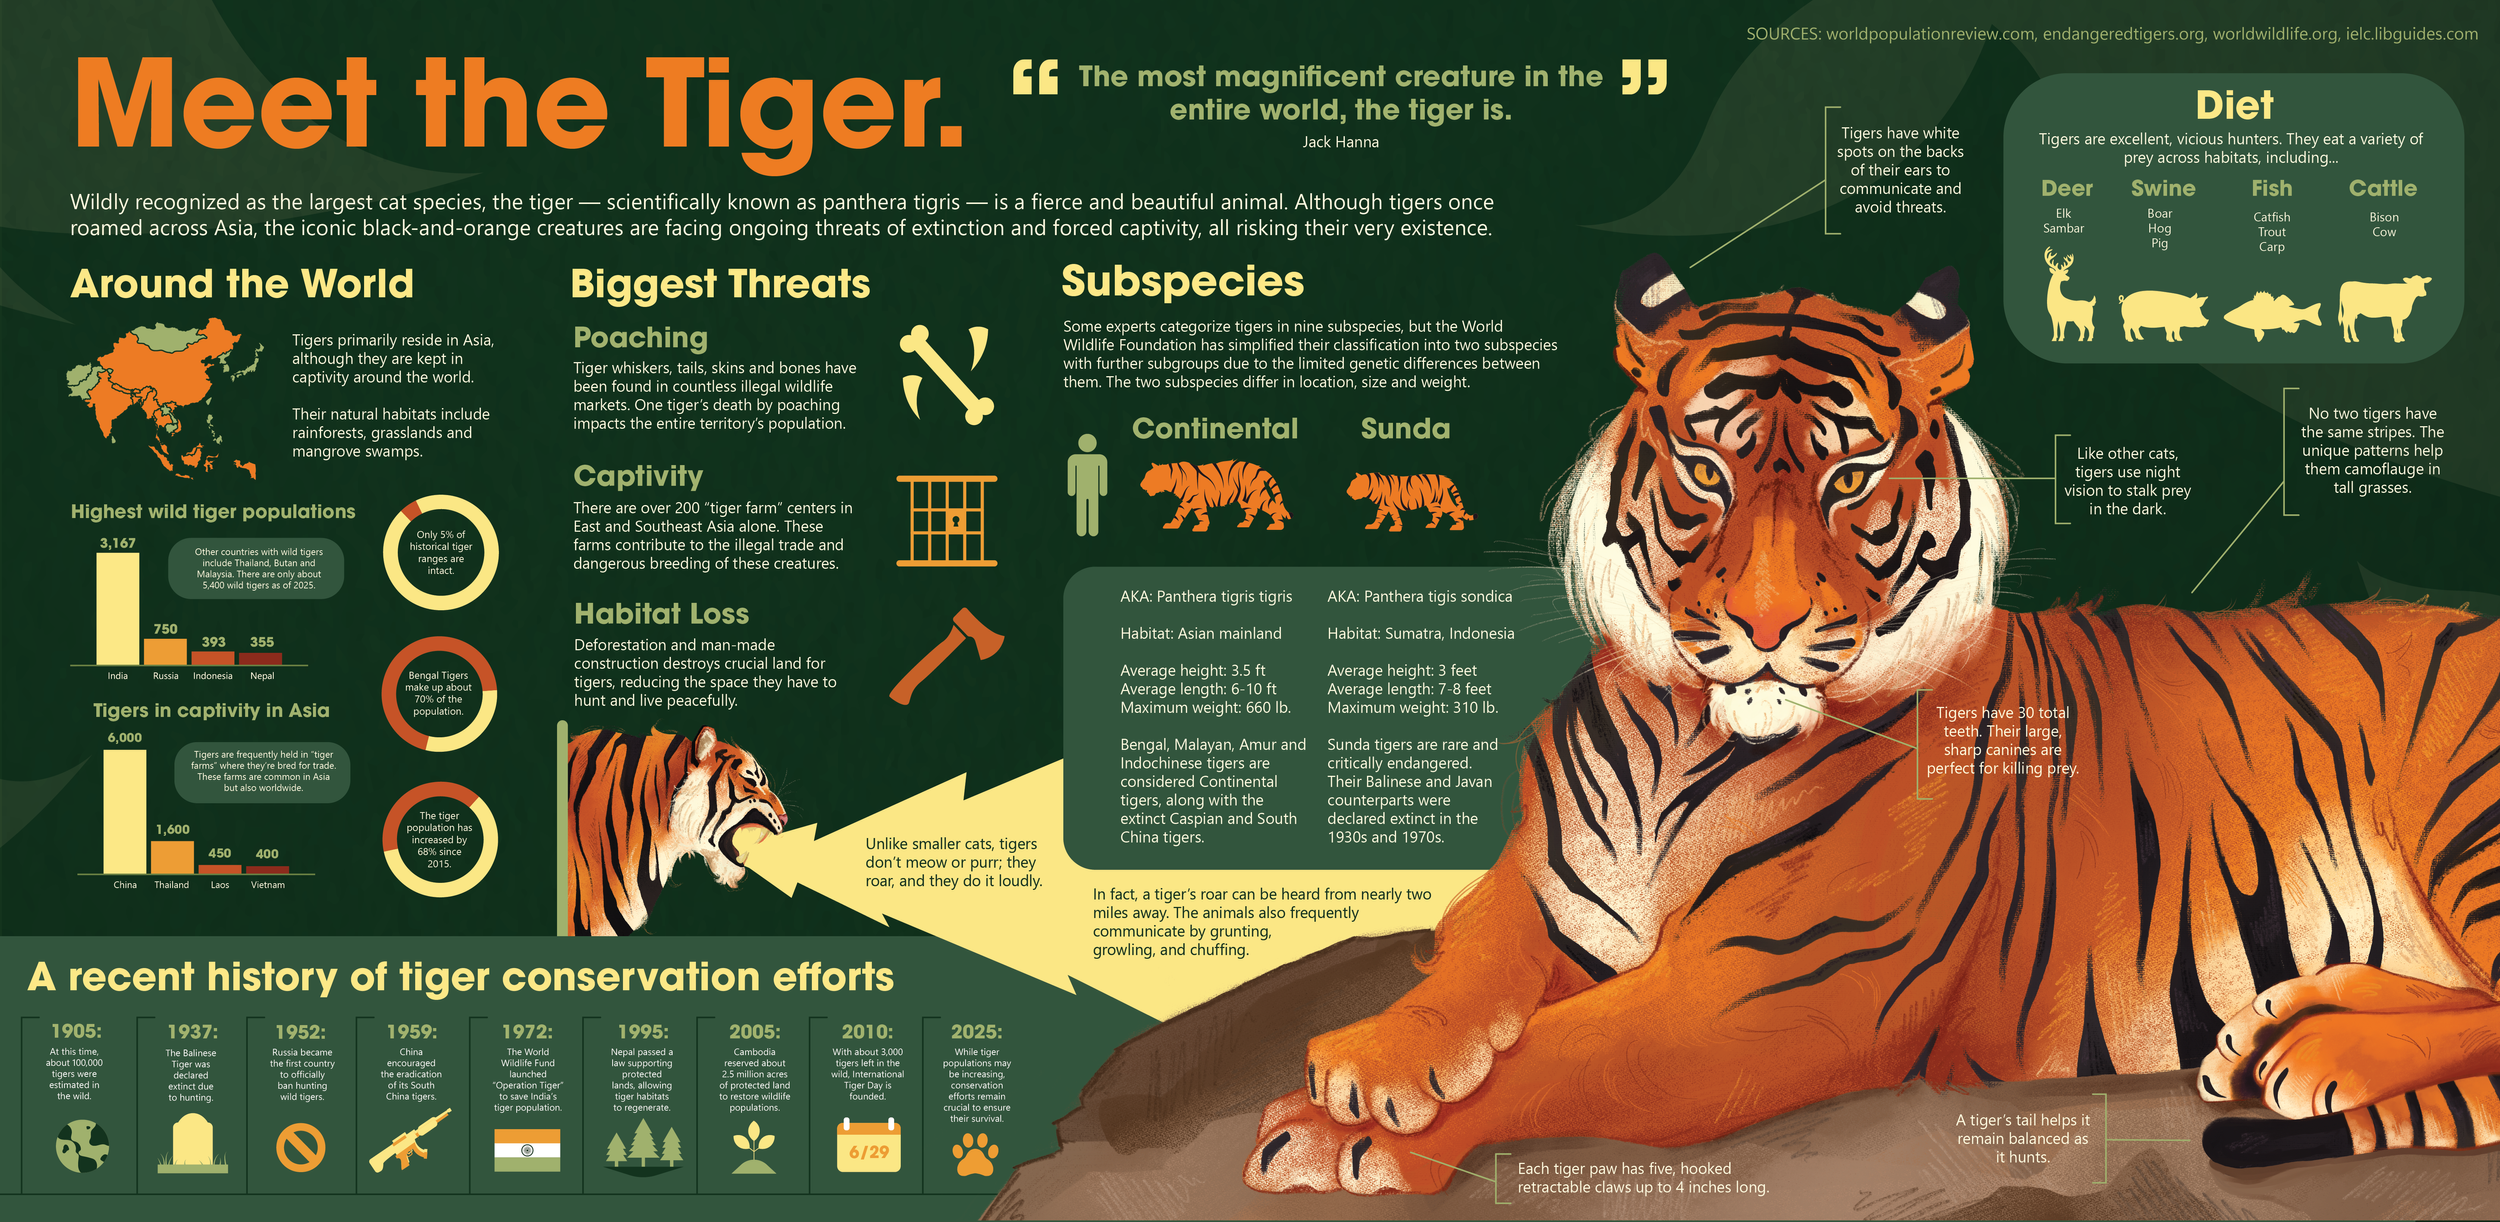
Meet the Tiger
This infographic features hand-drawn illustrations, graphs and vector wireframes to illustrate information about tiger conservation, threats, subspecies and habitats, as well as fun facts.
-
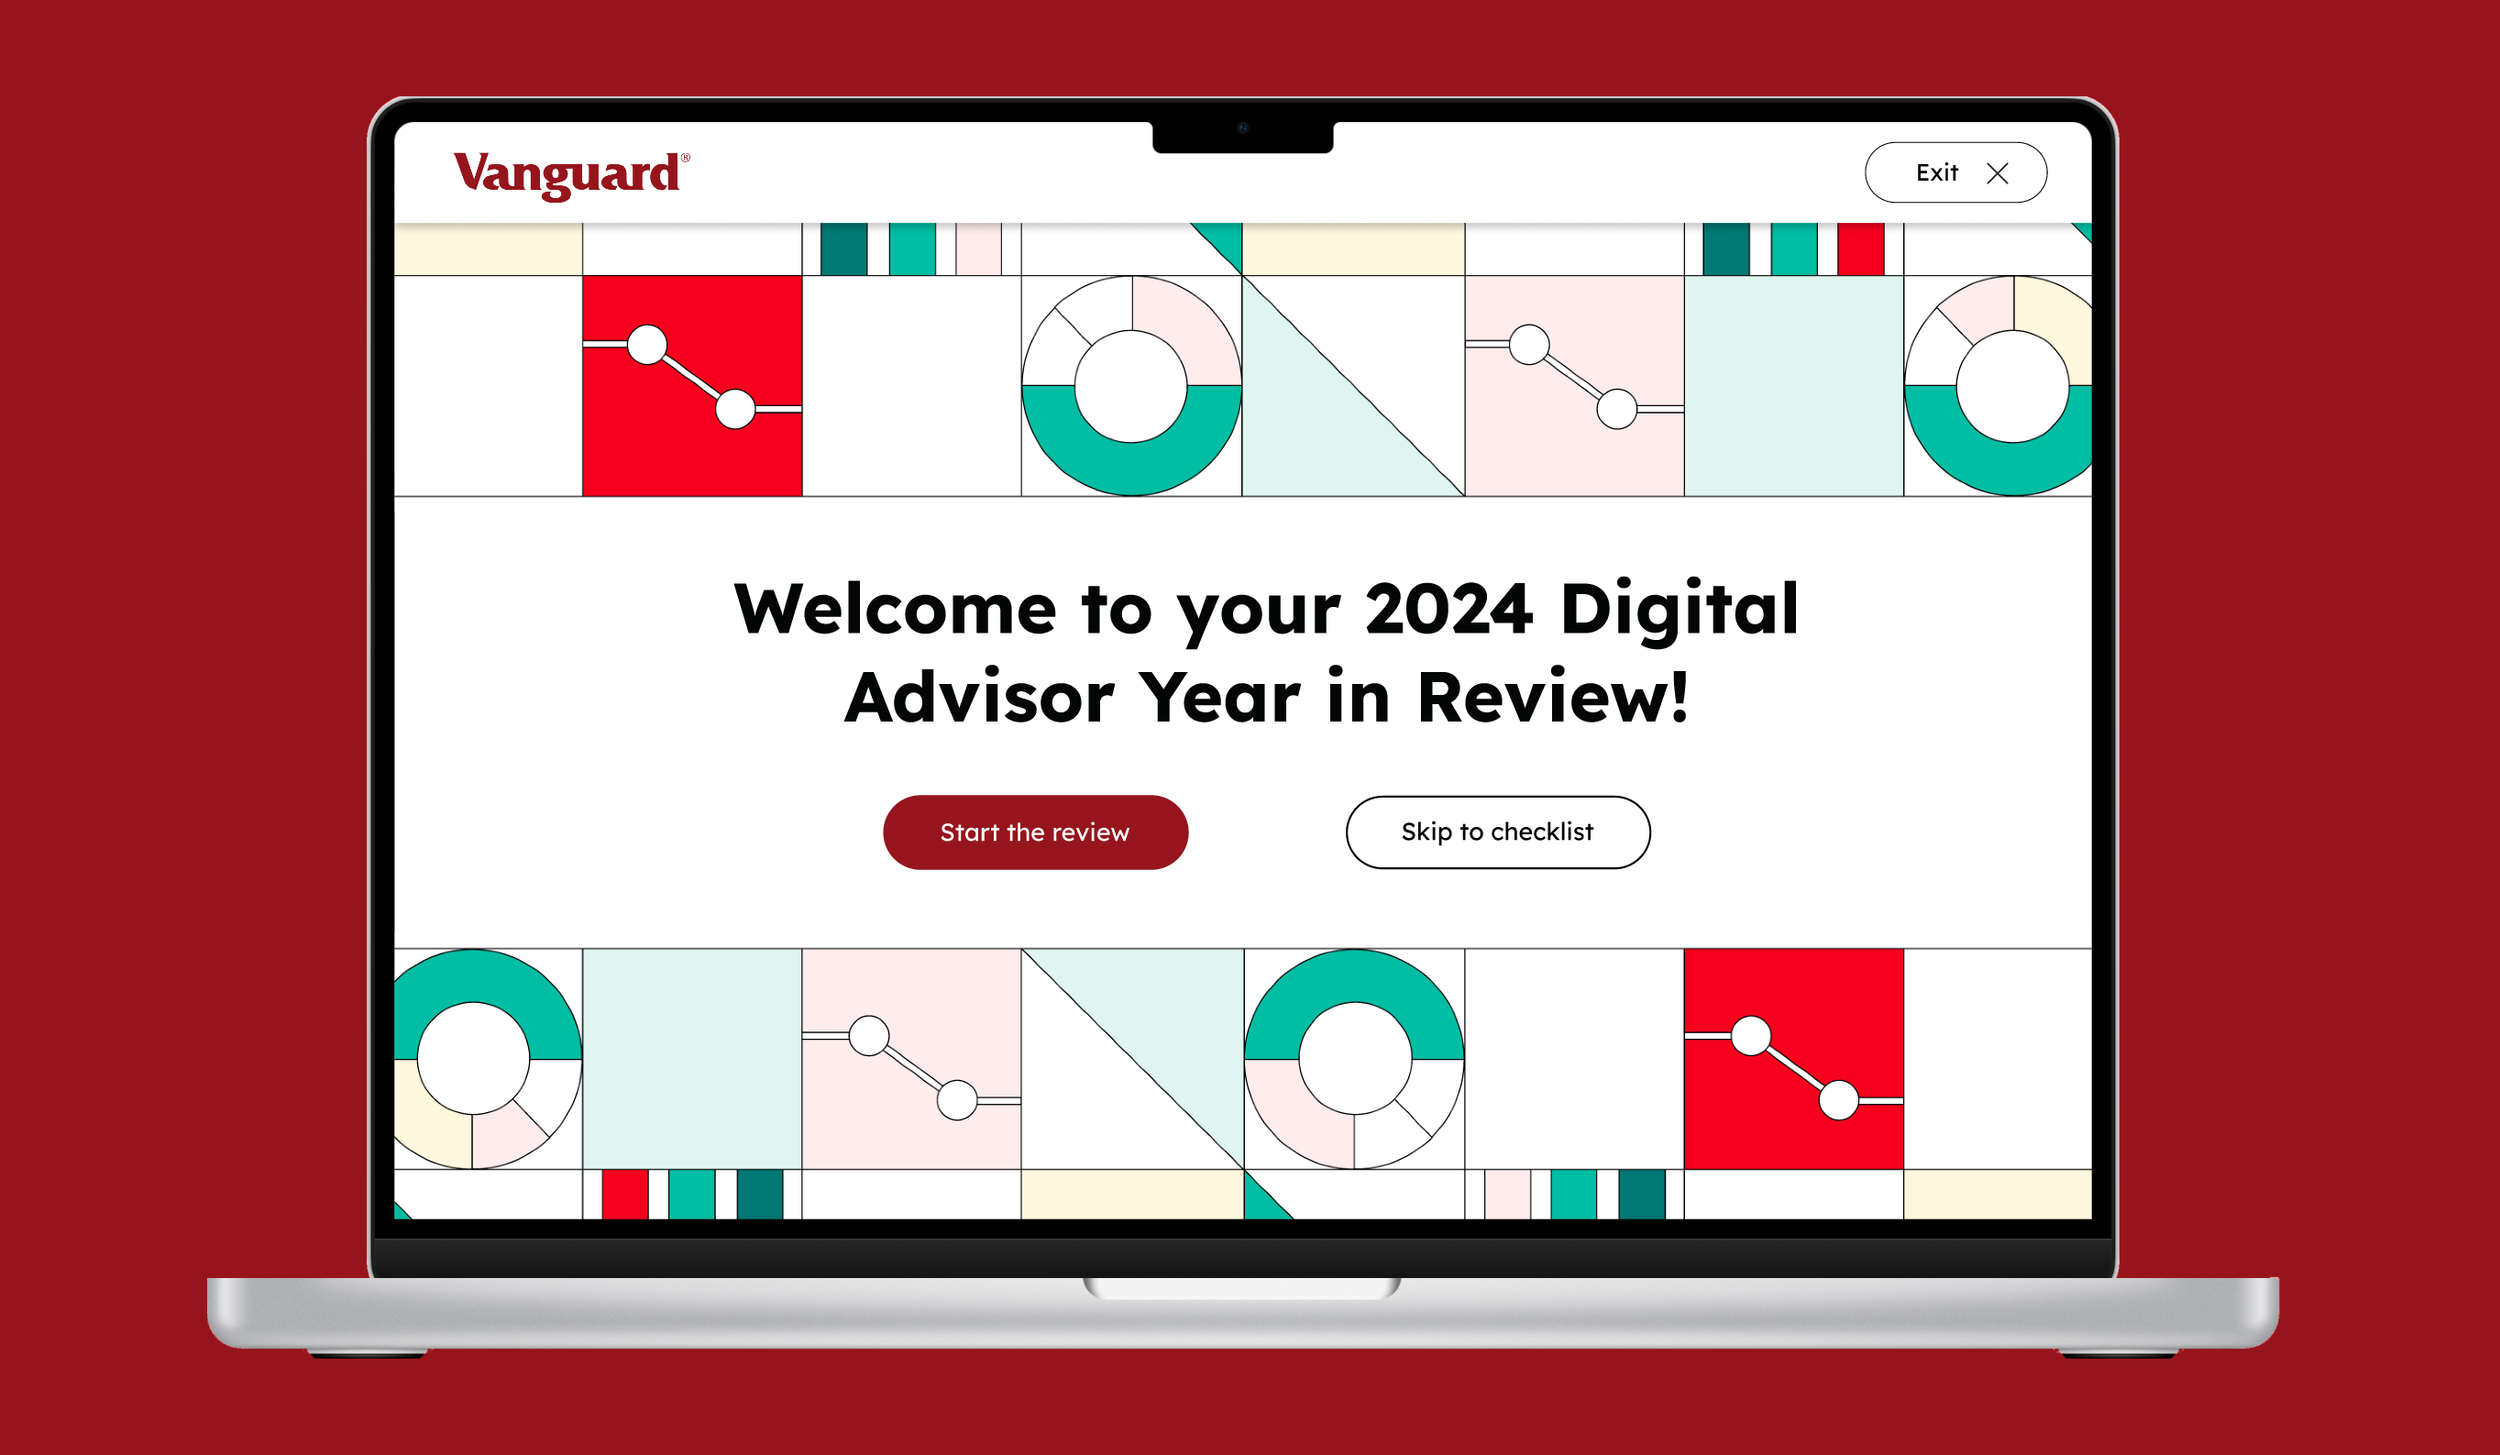
Vanguard Year in Review Case Study
As part of my UX design course, I was given the opportunity to work with Vanguard UX designers, conduct usability test and user reserach, and pitch a redesign of their Year In Review interface.
-

The Decline of Democracy
I created this cover, as well as a style guide and back page, as creative director of my 9-person class designing a mini-magazine about the state of American democracy.
-
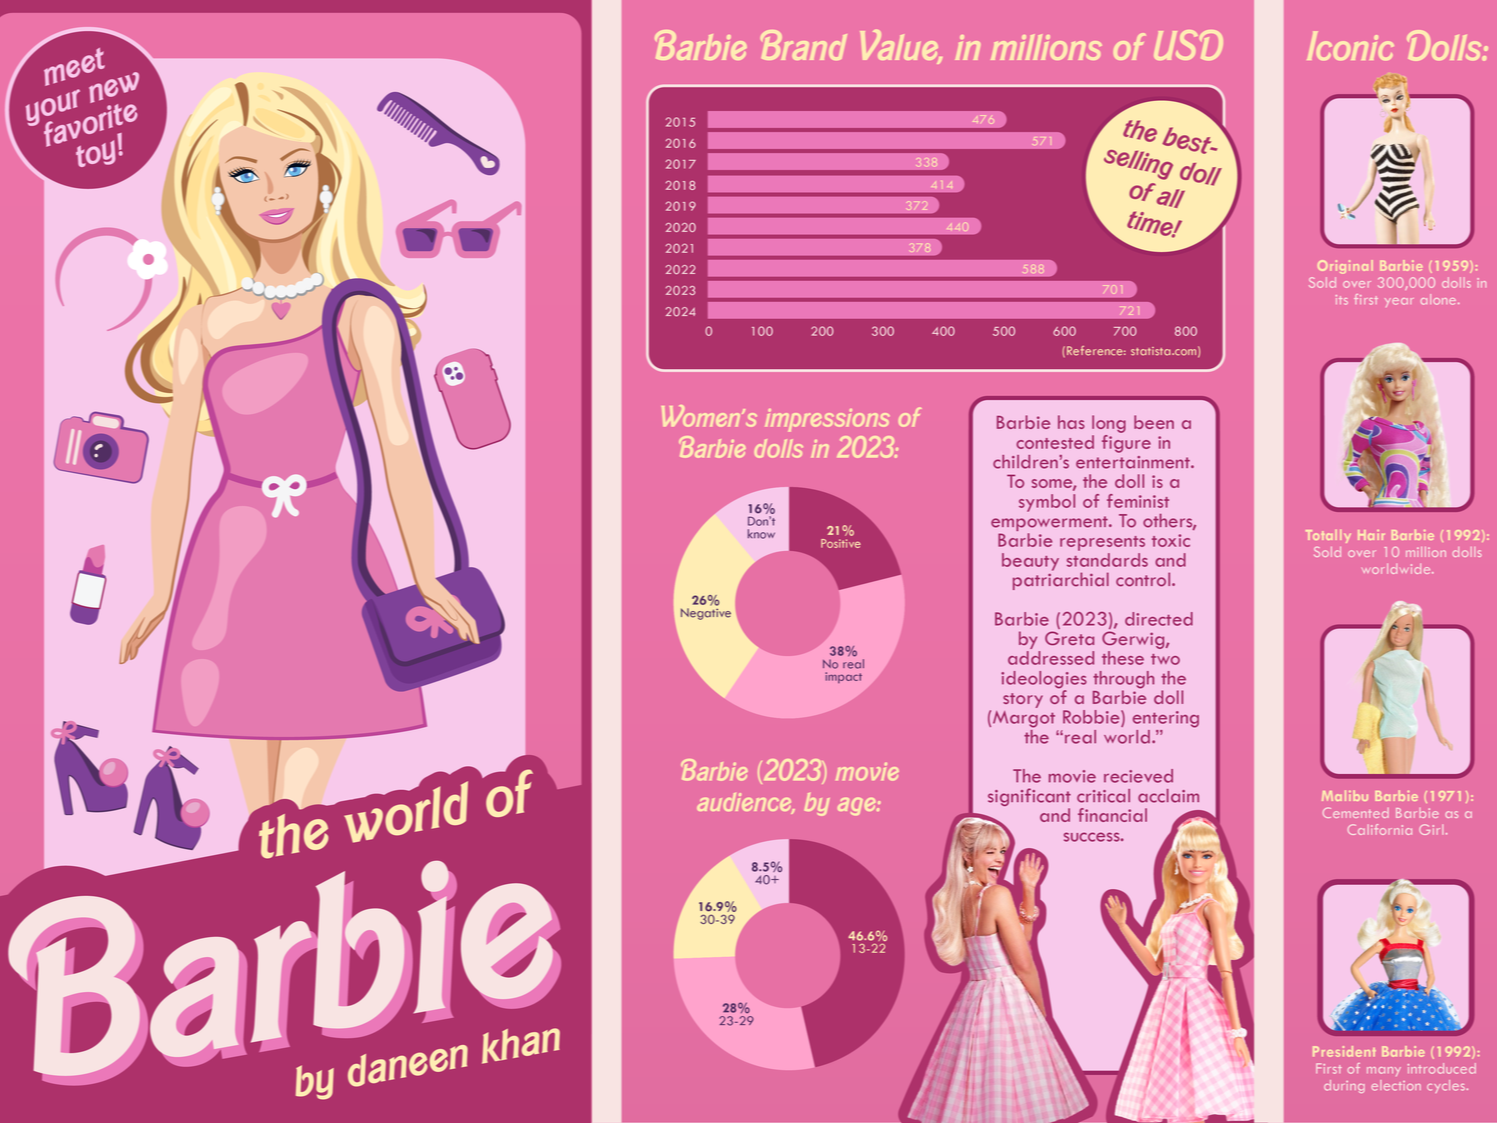
Barbie Infographic
This infographic was for my Introduction to Graphic Design course. I utilized Adobe Illustrator, Photoshop and InDesign to put the piece together.
-
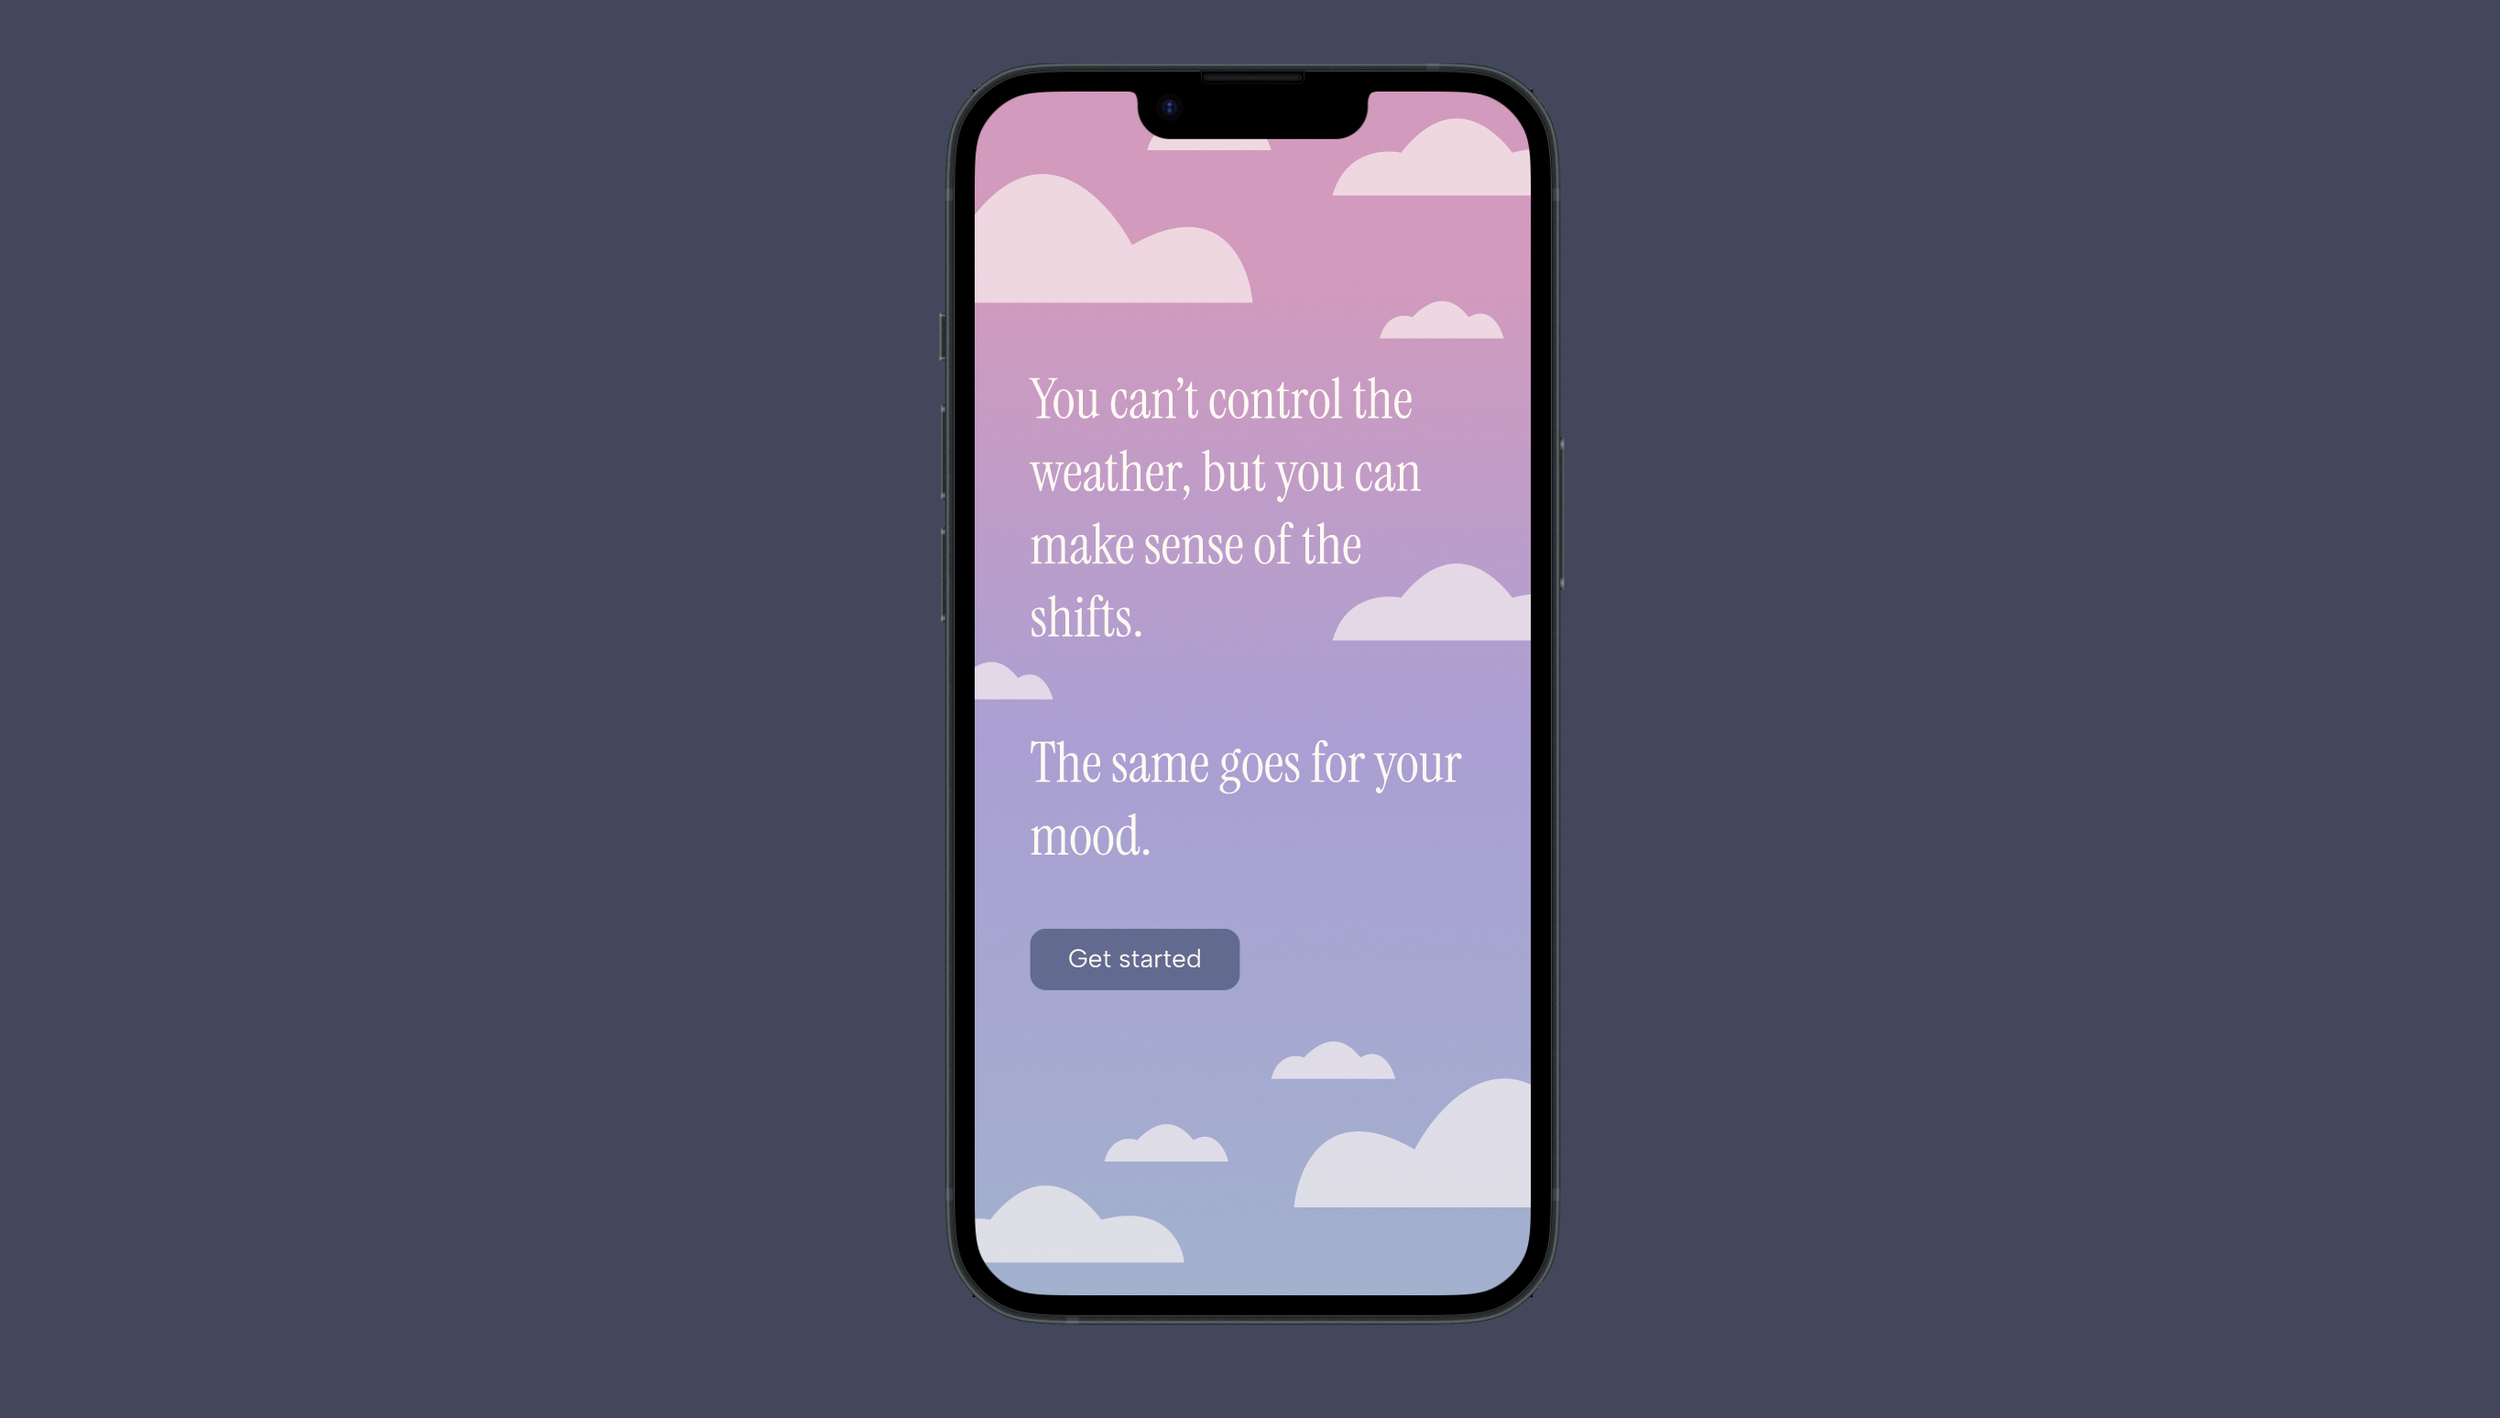
Mood Tracker App
I created this mobile design for a UX/UI course. The assignment was simple: to “design for social good.” My project was a weather-themed mood and habit tracker with a built-in daily act of kindness.
-
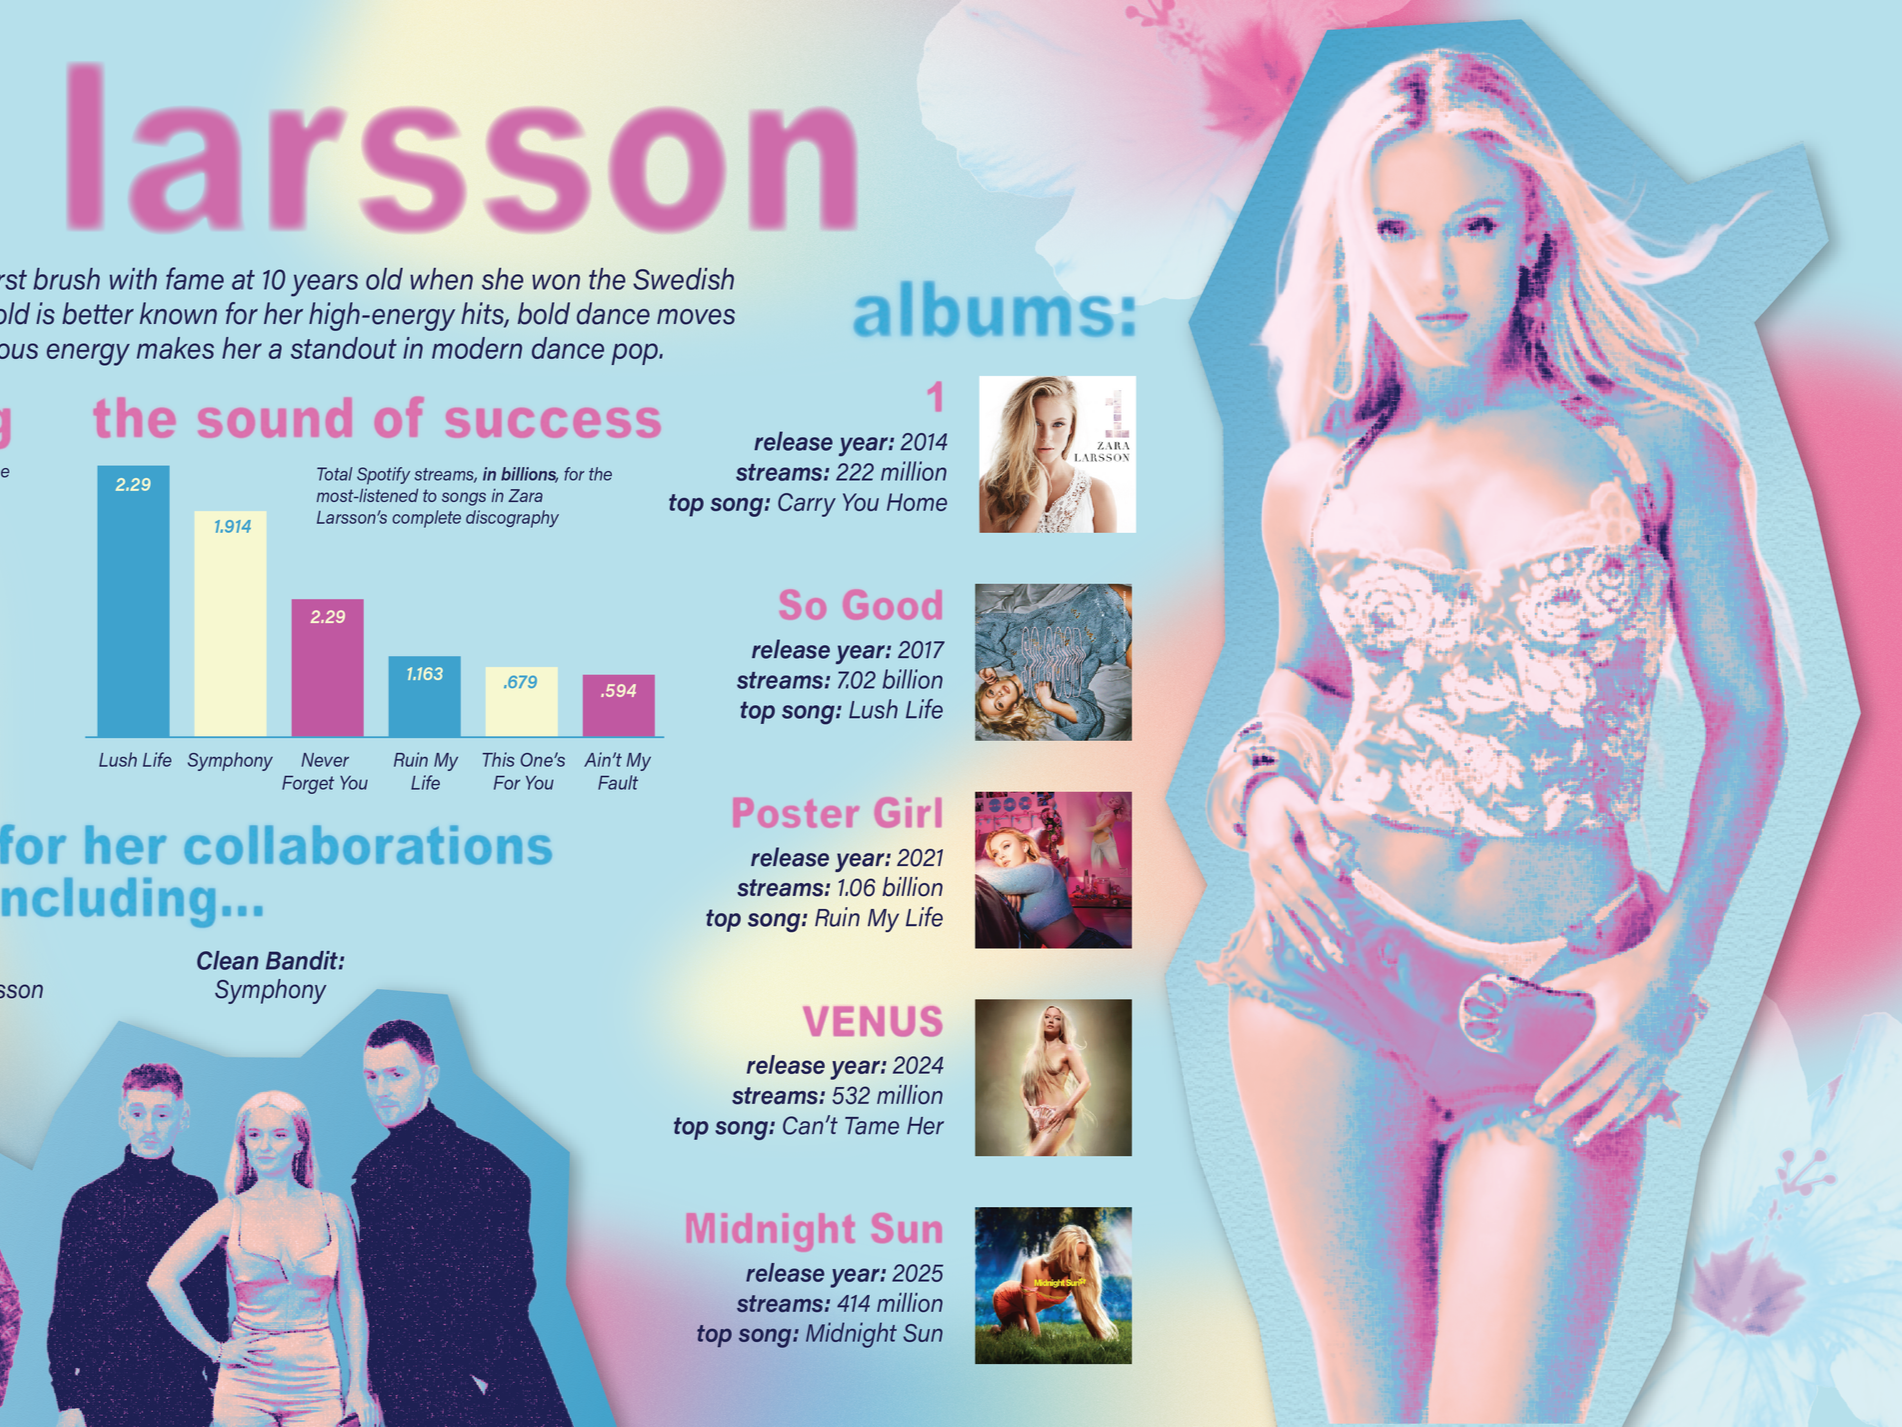
Zara Larsson Infographic
This was a personal project to explore infographics without illustrations. I used Illustrator and Photoshop to create this spread.
-
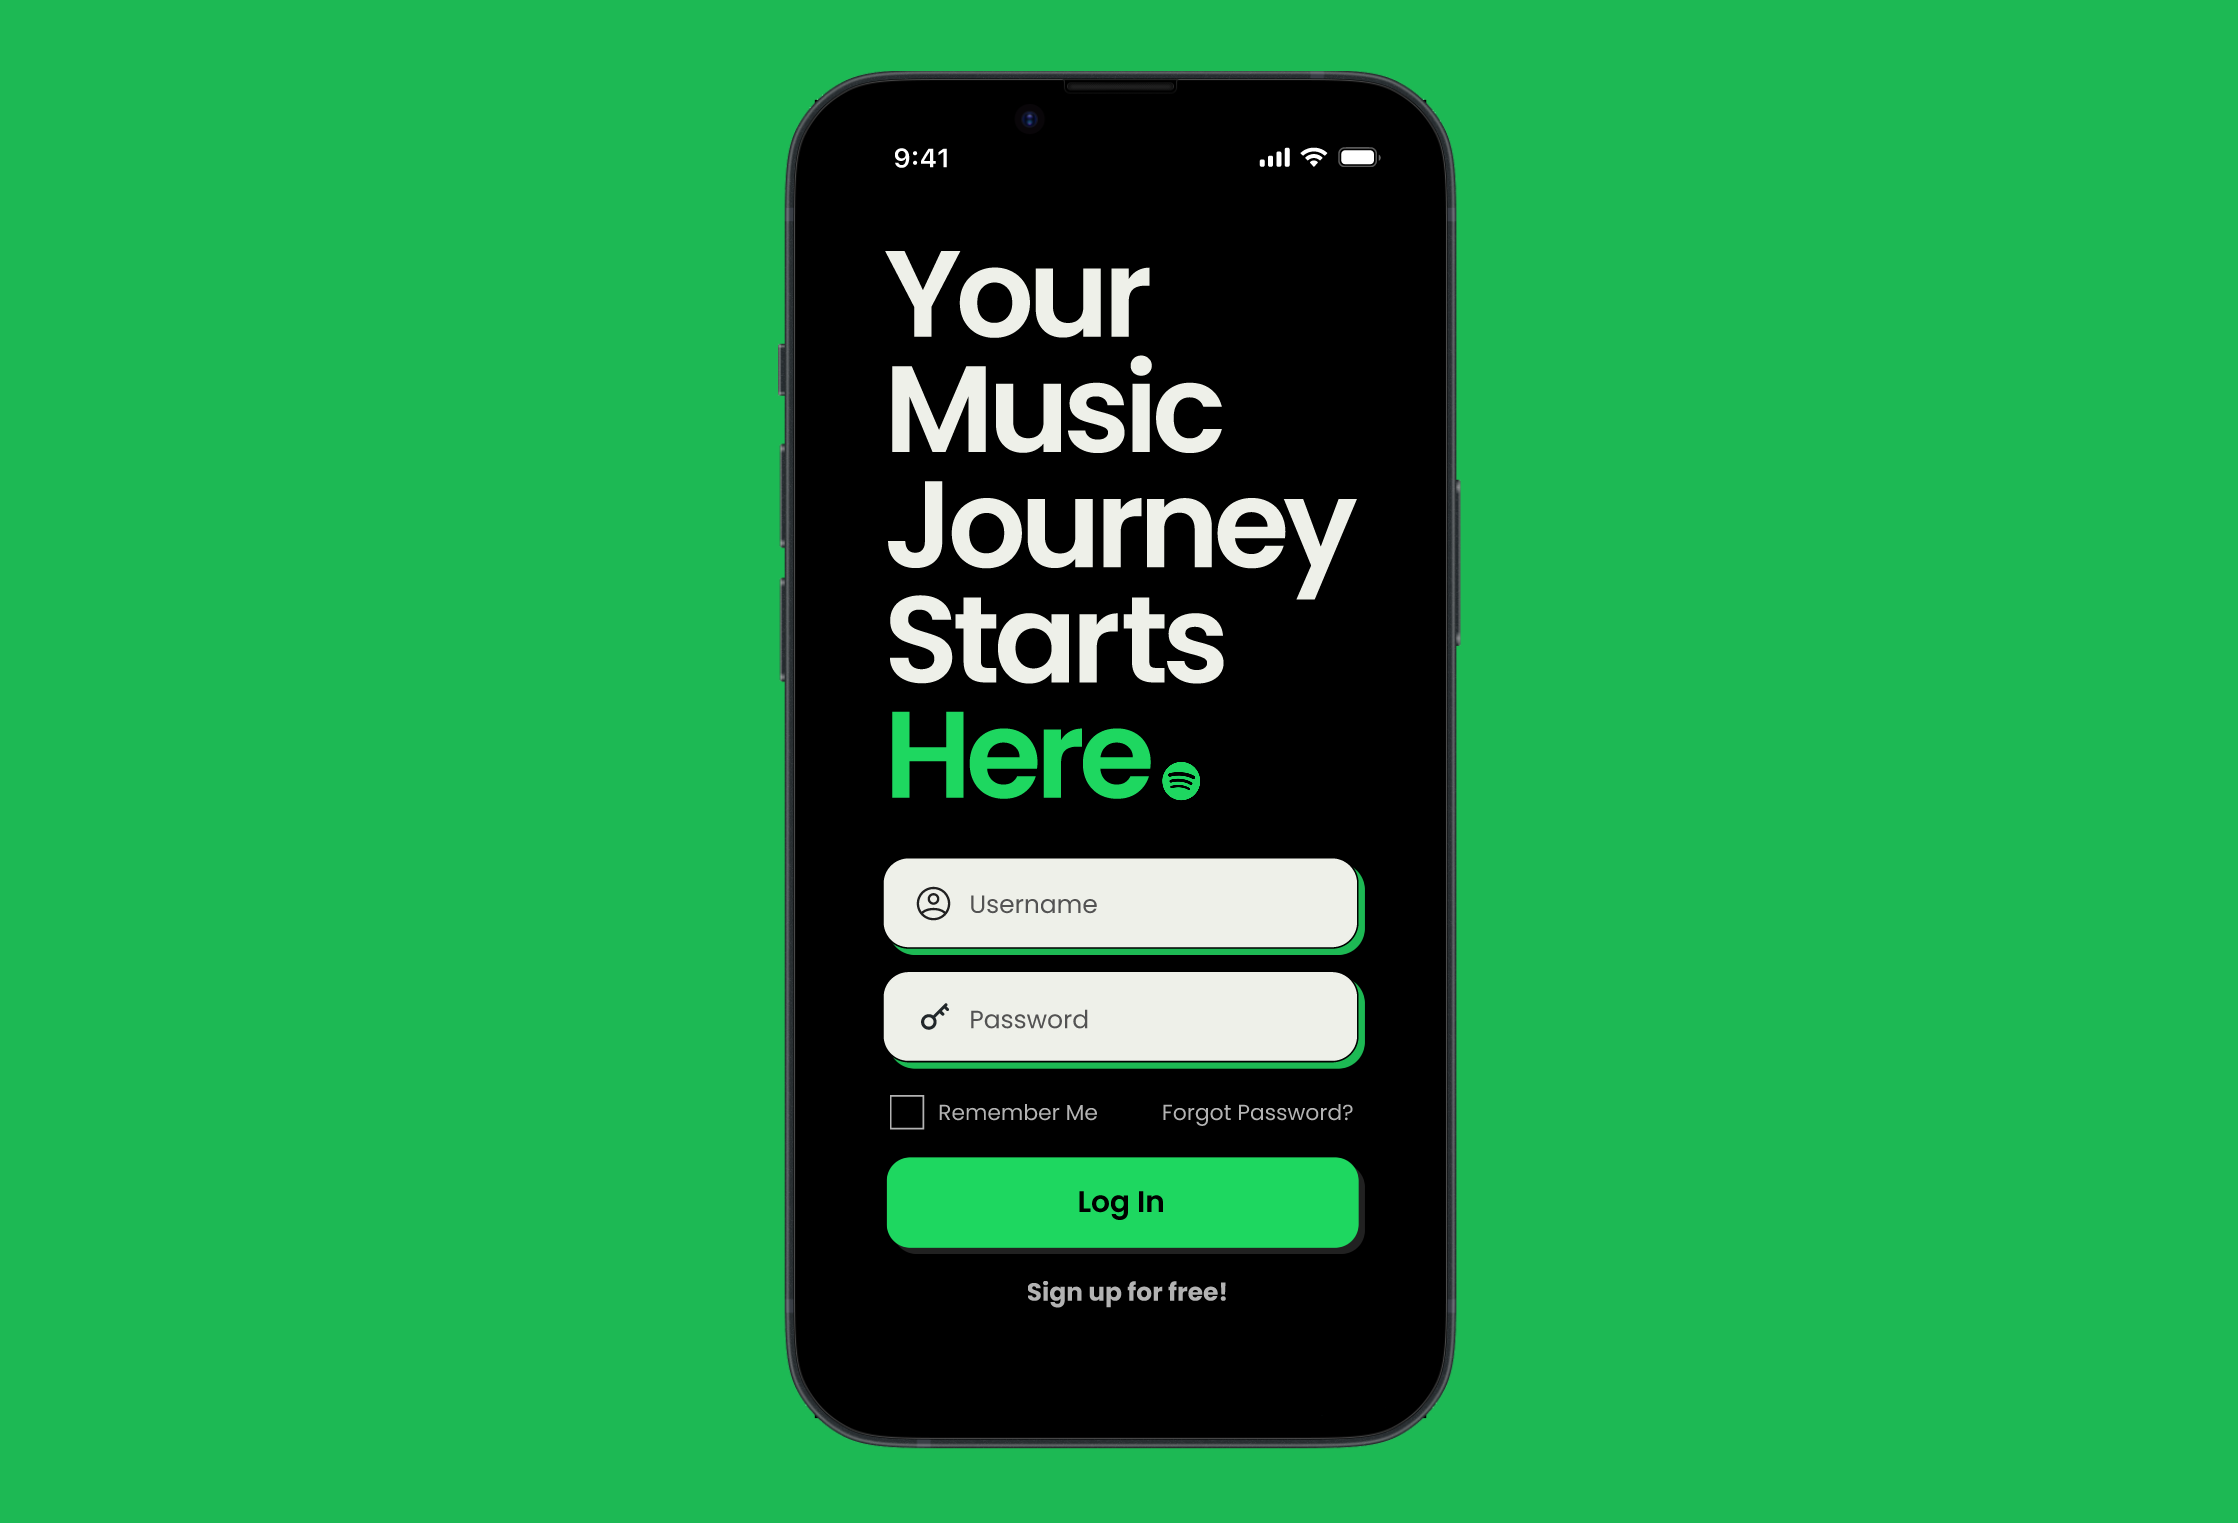
Music App Redesign
Another class project, this assignment required me to redesign a popular music app for a 60+ age demographic. I chose to revamp Spotify, my personal favorite music streaming service.
-
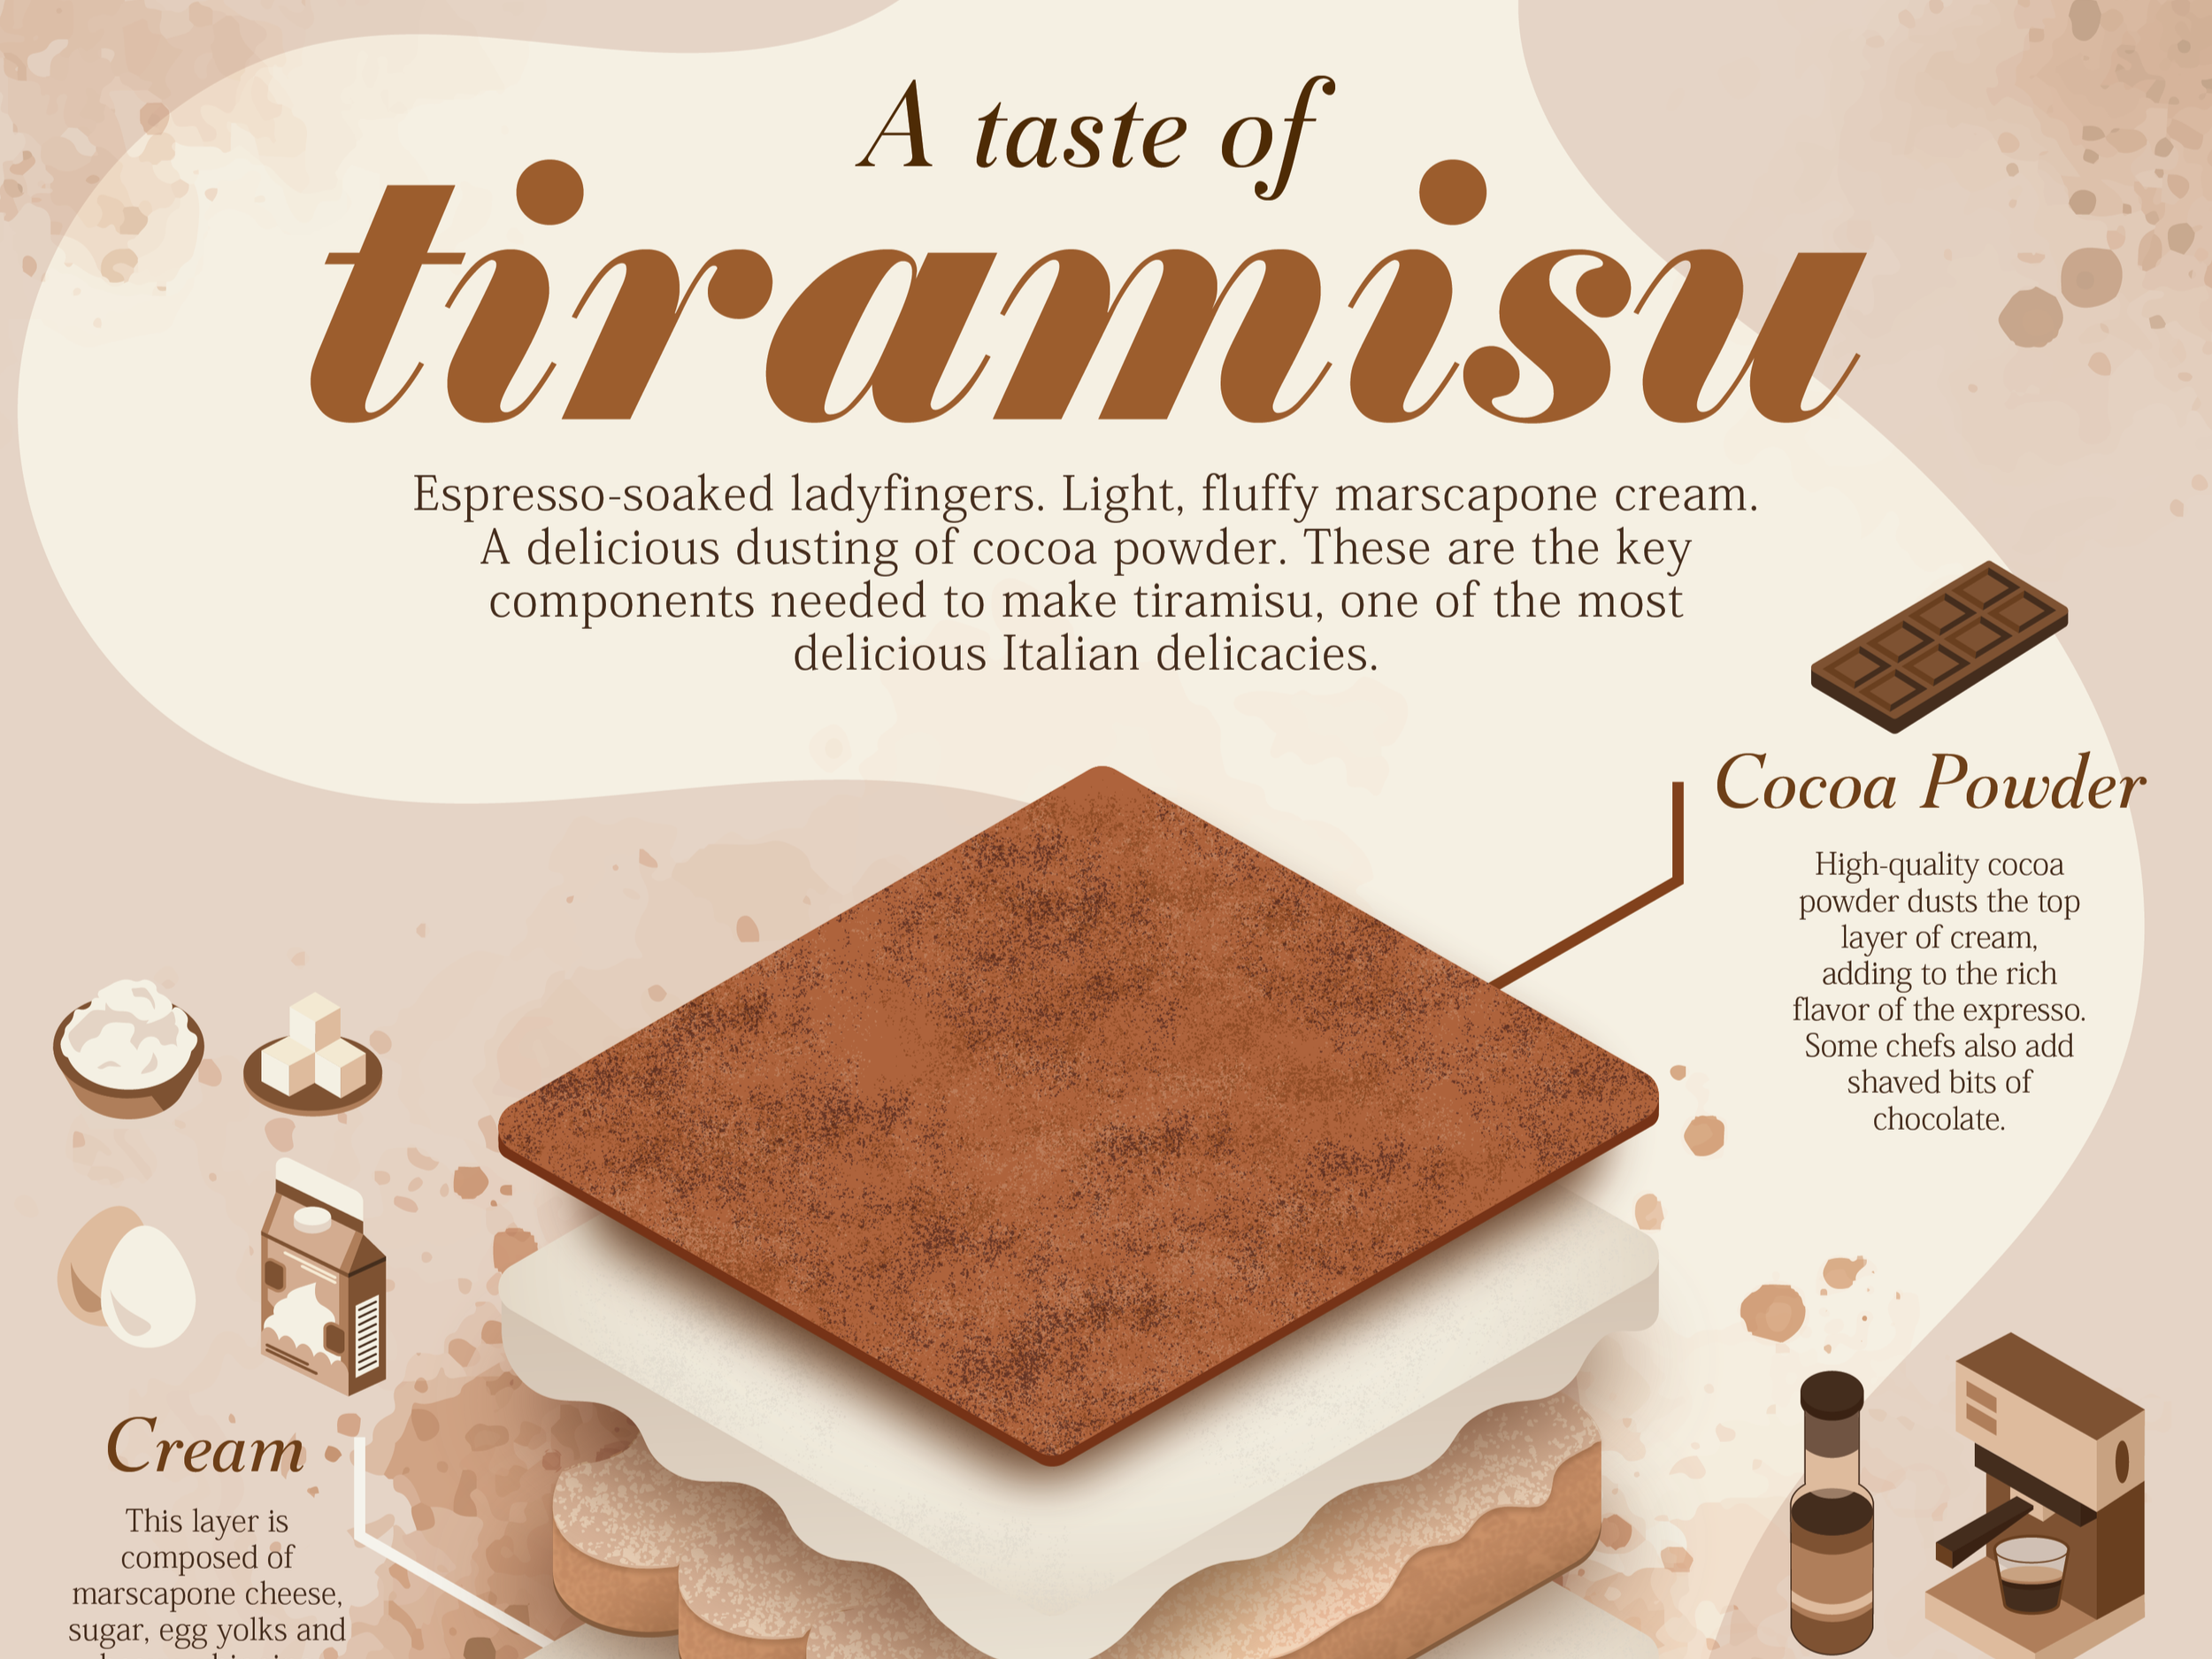
A Taste of Tiramisu
I created this simplistic infographic to break down the structure of one of my favorite desserts: tiramisu. It features isometric elements and detailed illustrations, all designed with Illustrator and Photoshop.
-

DTH Graphics
Although I don’t typically create graphics for The Daily Tar Heel, this was one of a few simple illustrations I did for quick turnaround when a designer or cartoonist was unable to complete their assignment.
-
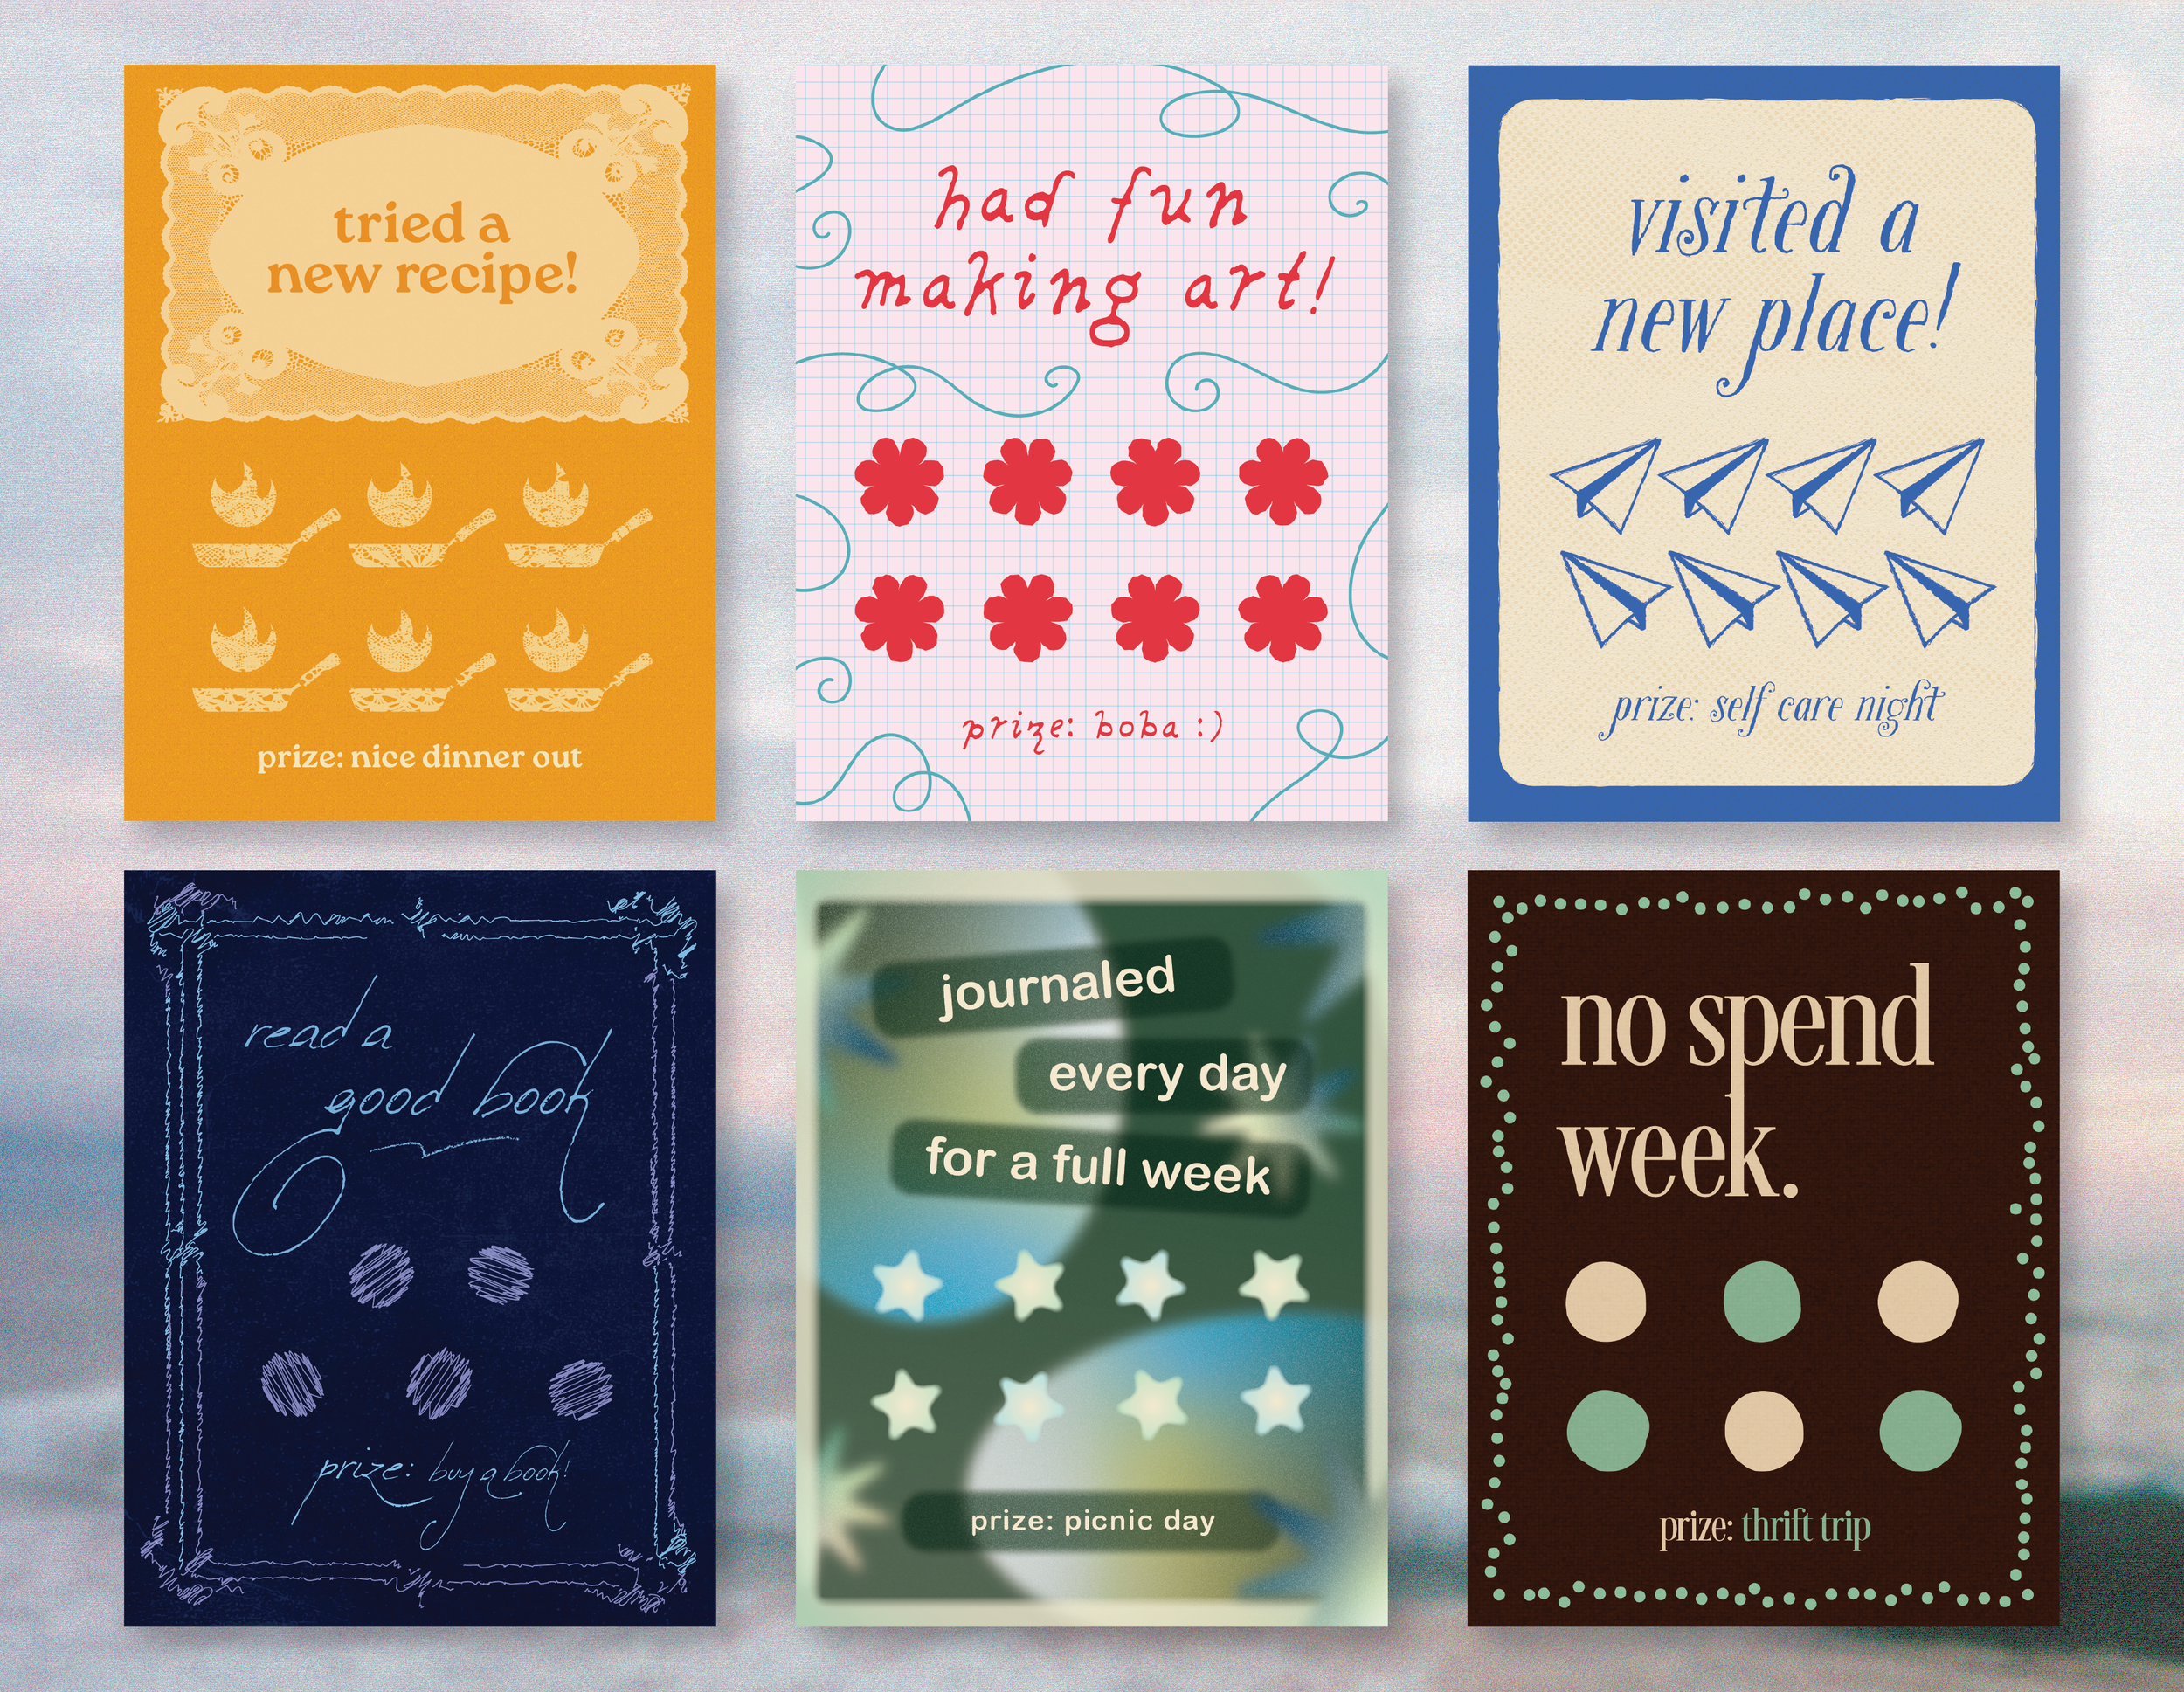
Punch Cards
This design sprint was based on a trend of making digital punch cards to build habits. I used Adobe Illustrator and tried to experiment with the software for each card.
-

404 Error Page
As a UX/UI class exercise, I chose to redesign the New York Times Cooking site’s 404 error page. The result is a dynamic, responsive and humorous addition to the site’s established branding.
-

History of Sesame Street
I used Adobe Illustrator to create this infographic about the history and mechanics of Sesame Street, one of my favorite childhood shows. This was a project for my Information Graphics course.