Before I was a writer, I was an artist.
My early sketches were done hunched over the kitchen counter, scribbling furiously on printer paper. Now, I prefer digital tools.
Graphic design lets me use my love for bright colors and bold typography to making news more interactive and accessible. In a digital-first news industry, visuals are everything; graphics reporting and interactive media, I think, are some of the most underutilized yet efficient tools to tell stories.
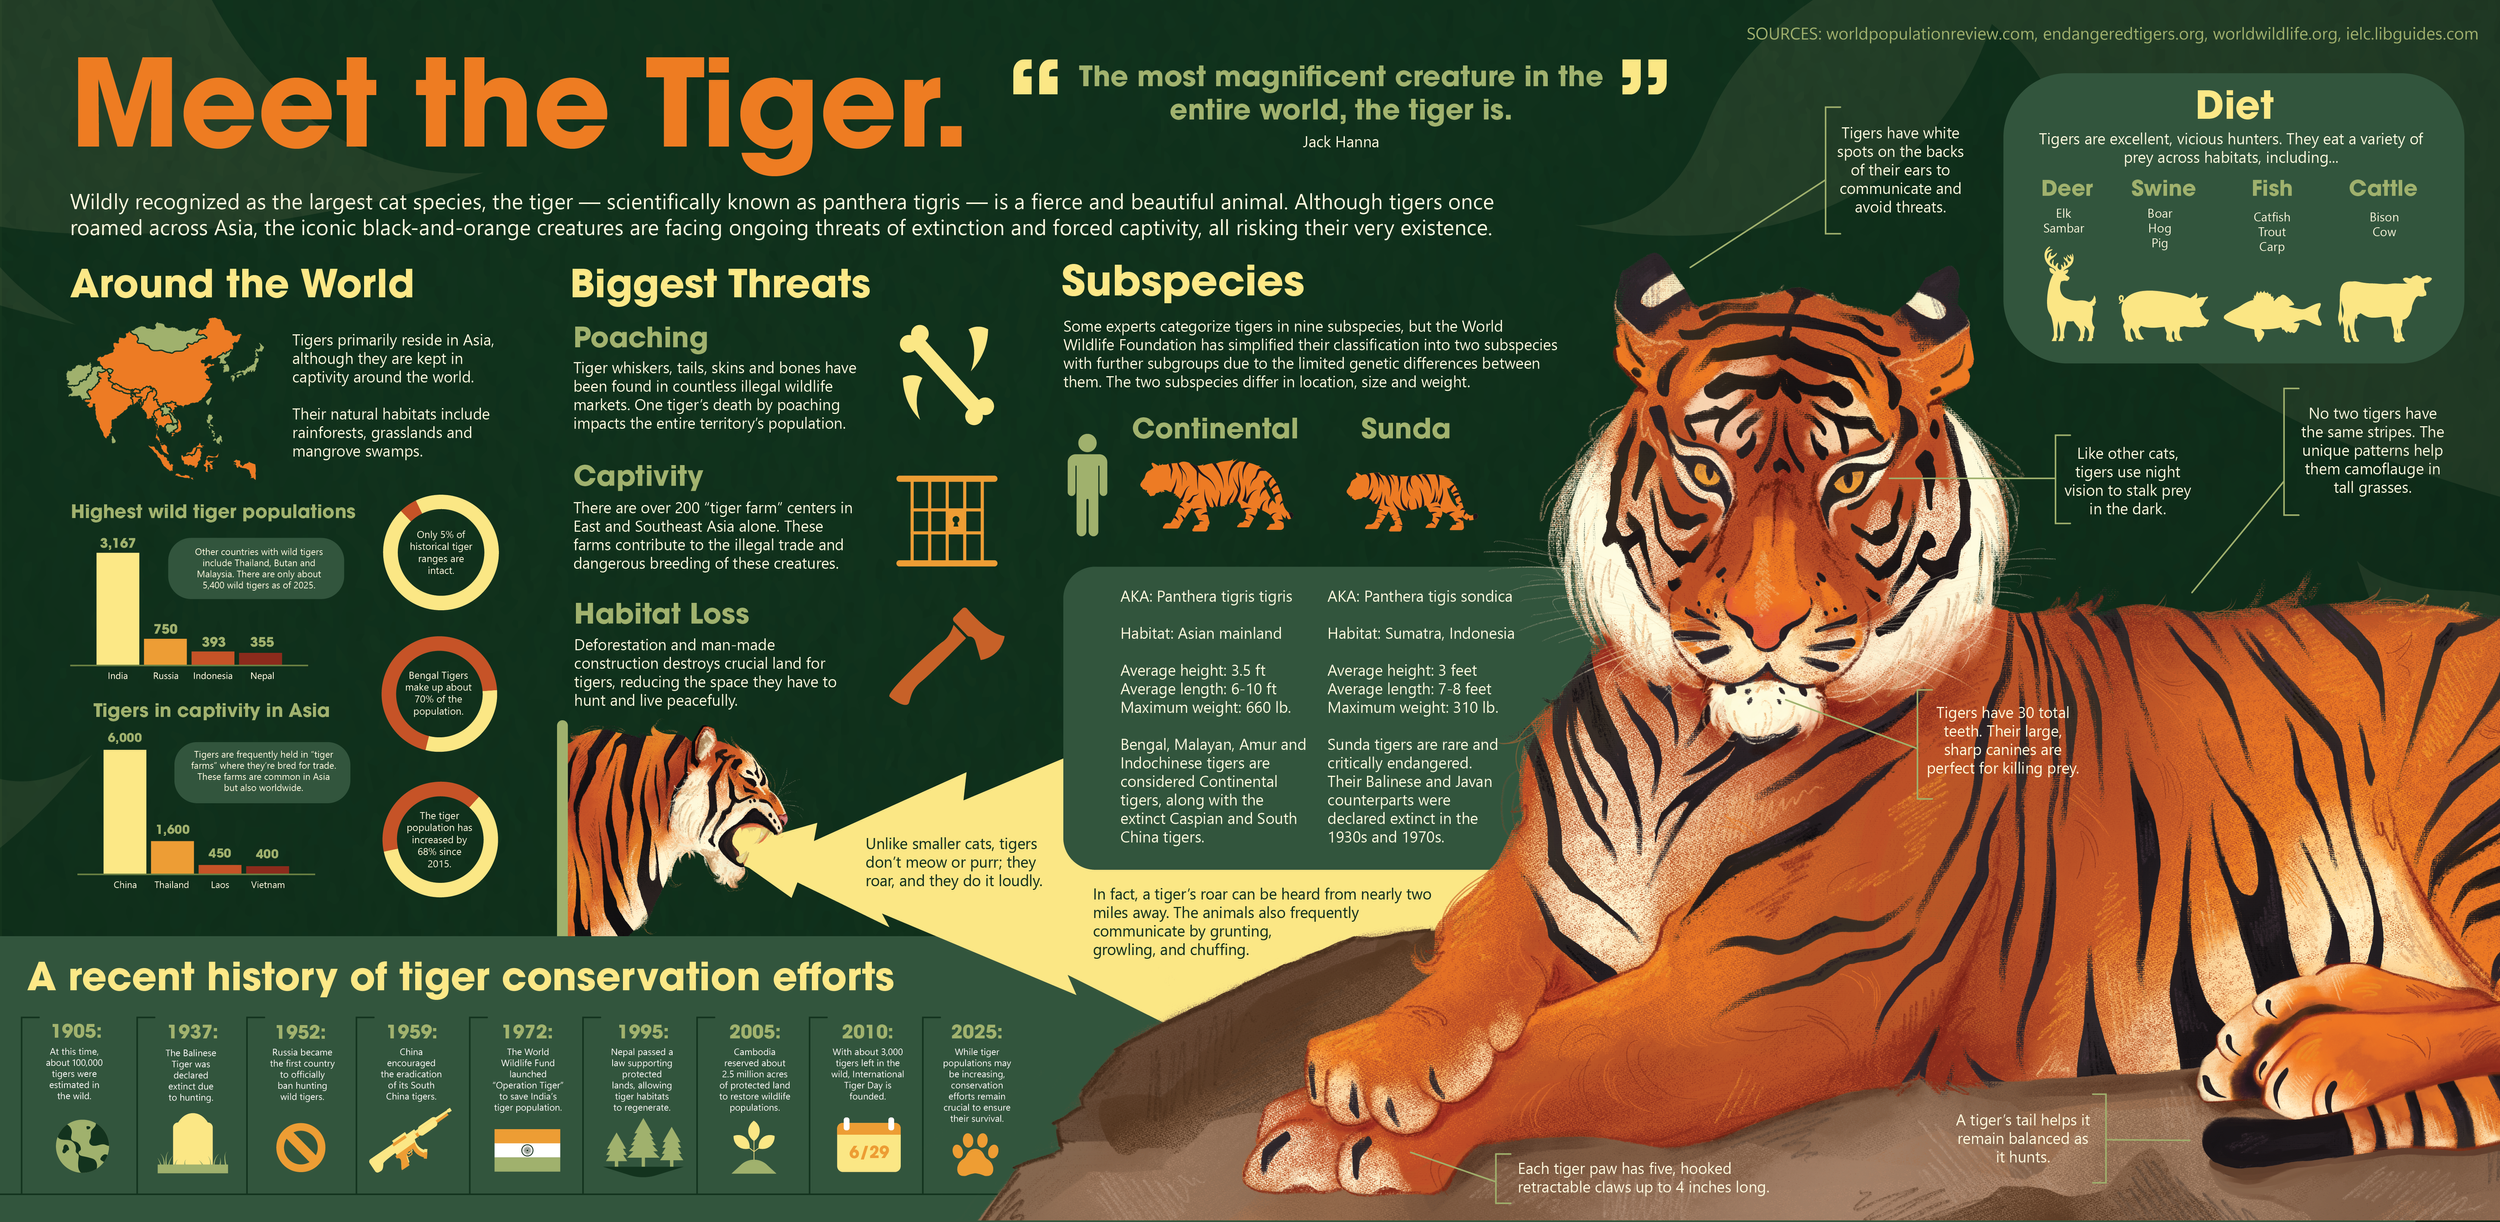
Meet the Tiger: I designed this infographic on Adobe Illustrator, with the tiger illustrations hand-drawn on Clip Studio Paint. It received an award of excellence from the Society for News Design and a People's Choice Award at the 2026 Society of News Design conference.
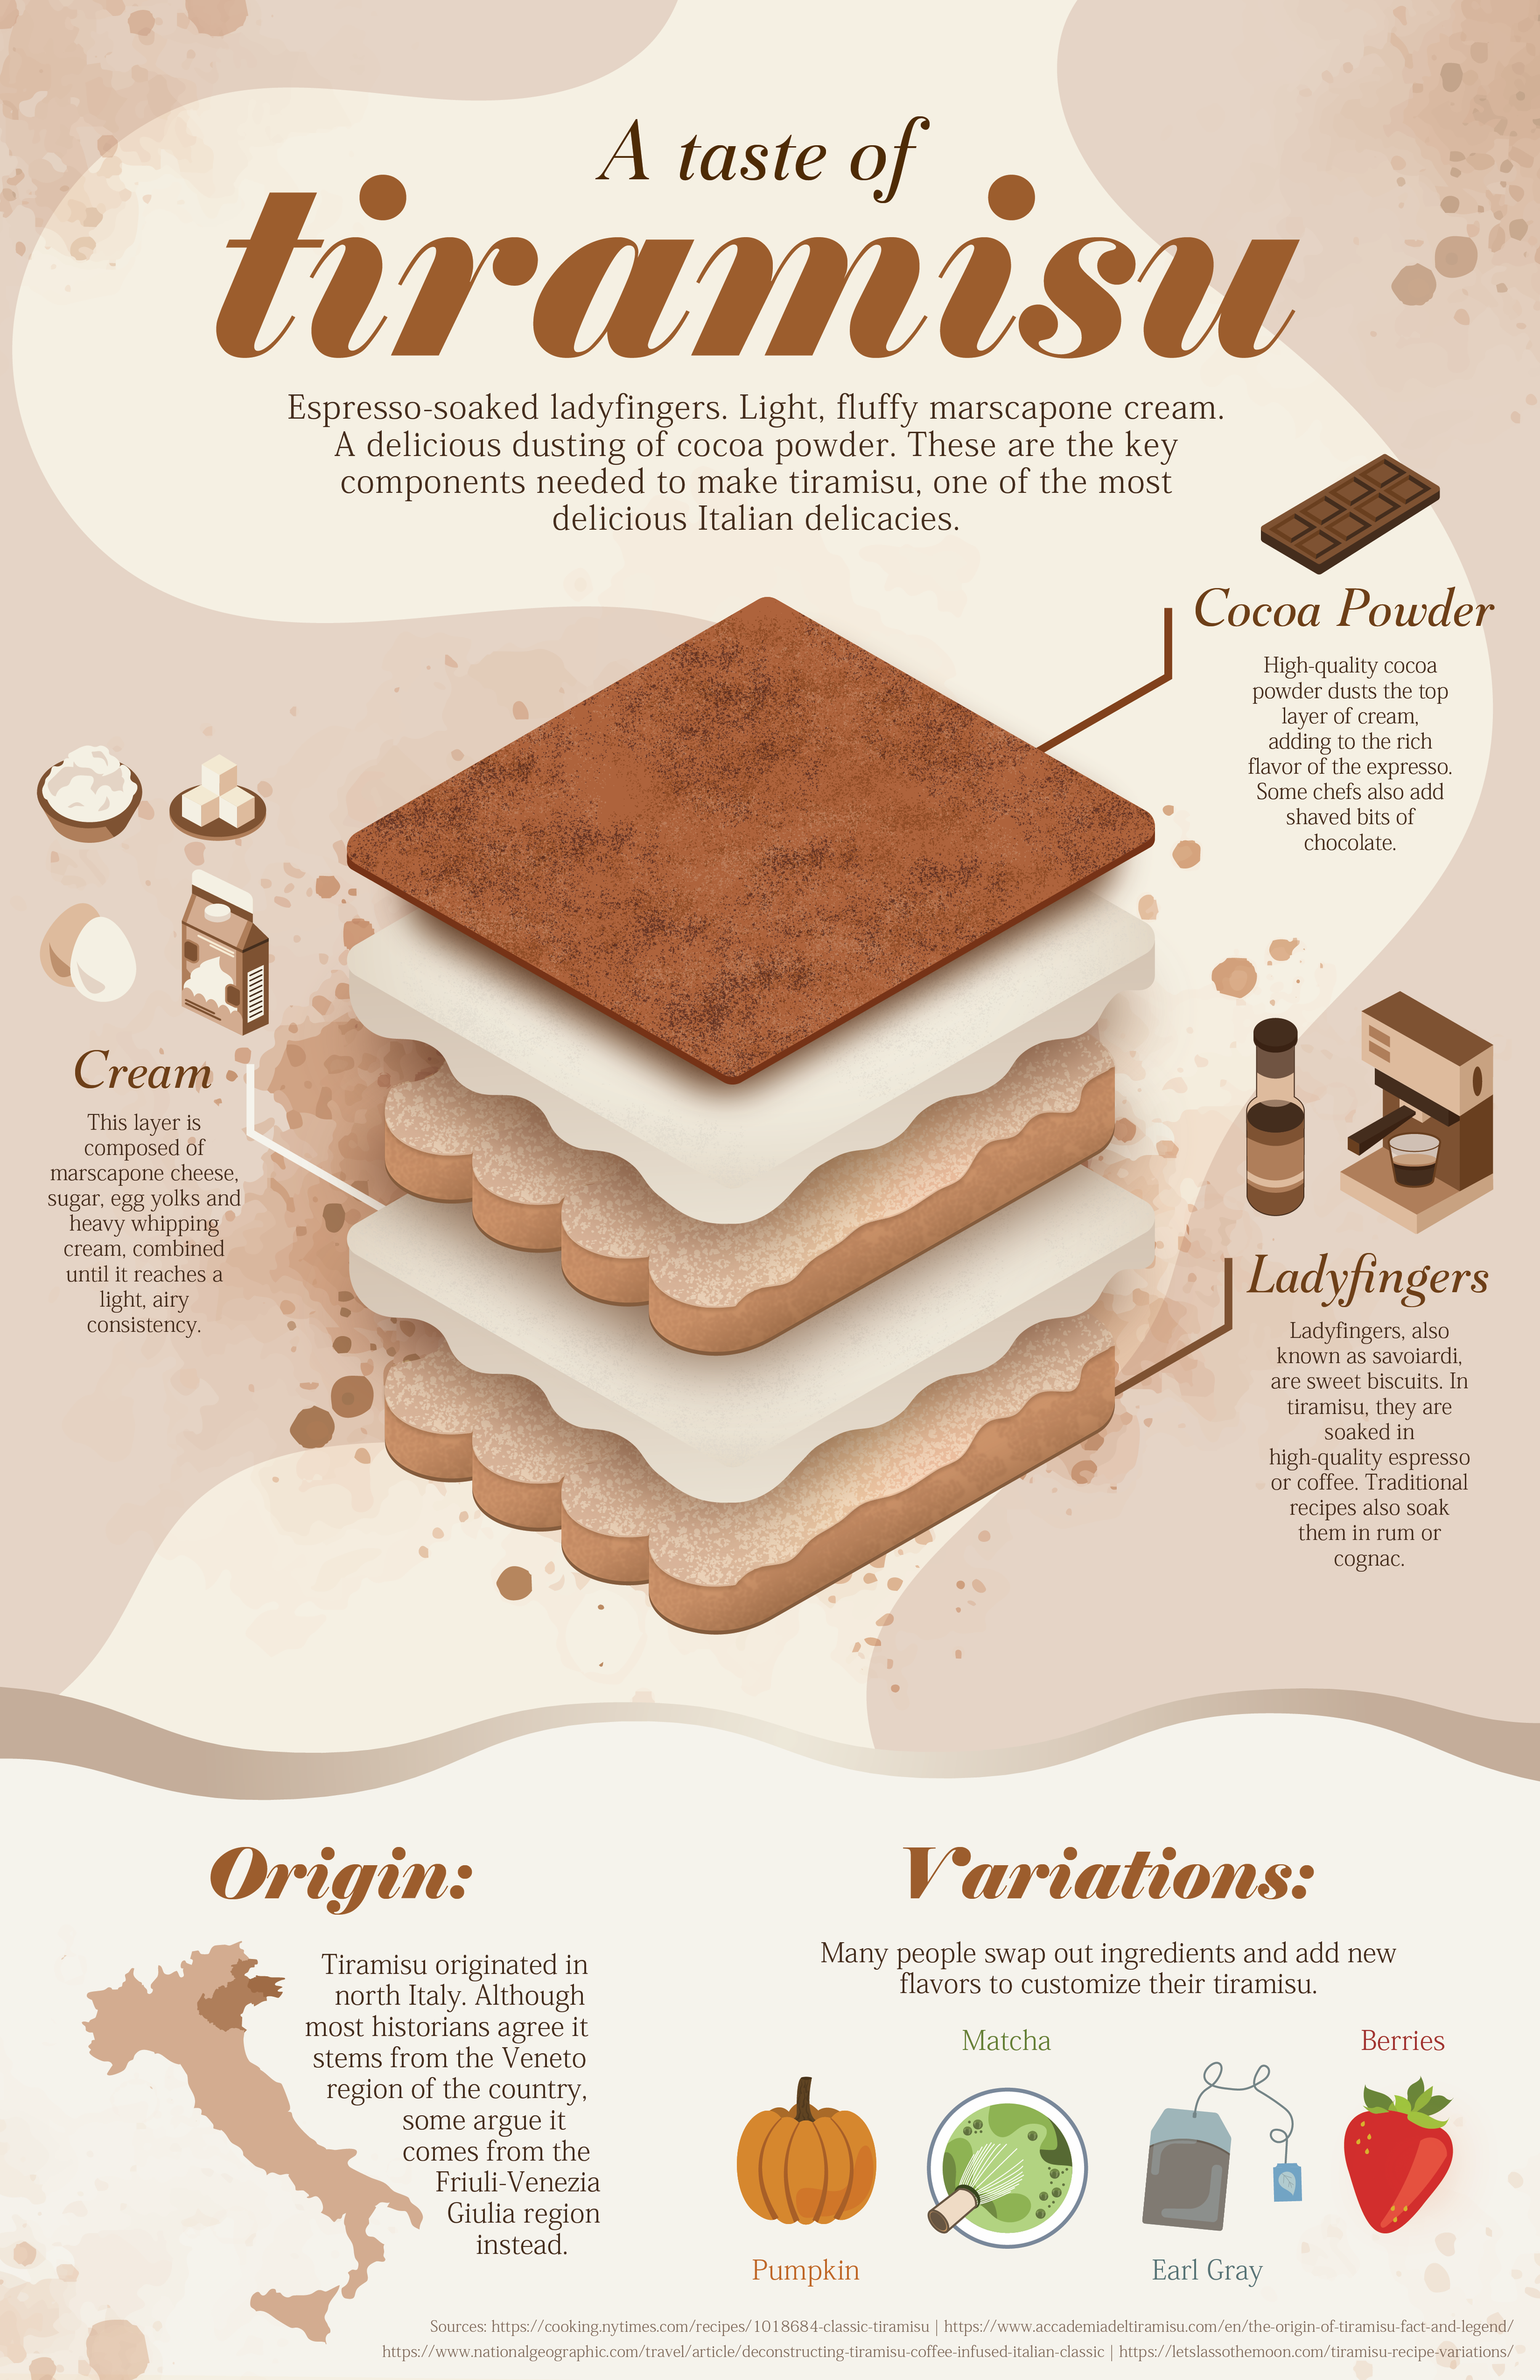
A Taste of Tiramisu: This infographic poster incorporated isometric design with organic elements to show the composition of tiramisu, my favorite dessert.

The Decline of Democracy: I led a team of 9 student designers in researching and designing a mini-magazine about the state of American politics. The cover and full magazine received awards of excellence from the Society for News Design.
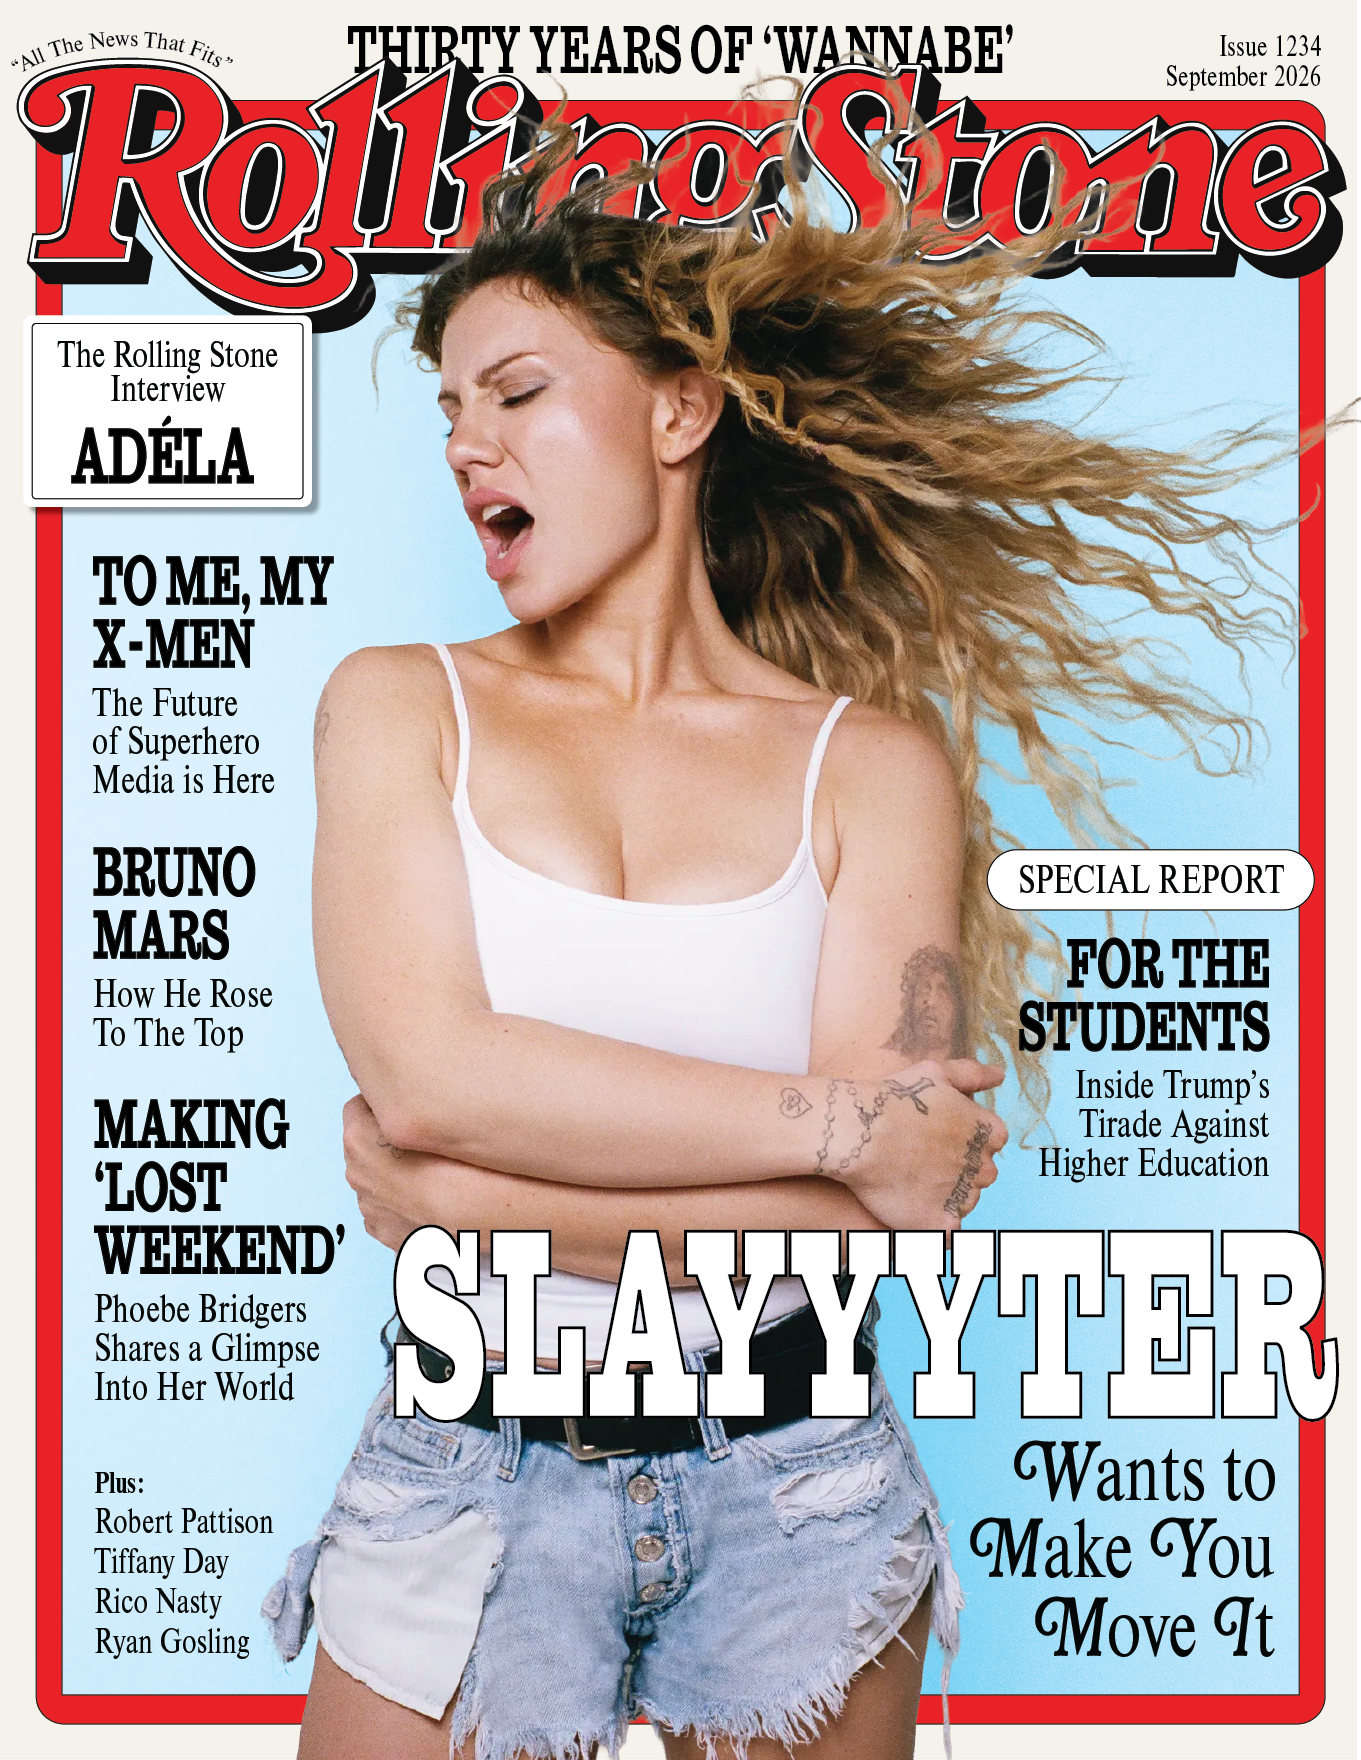
Mock 'Rolling Stone' Cover: I created this mock cover in my magazine design course, inspired by my own music taste.
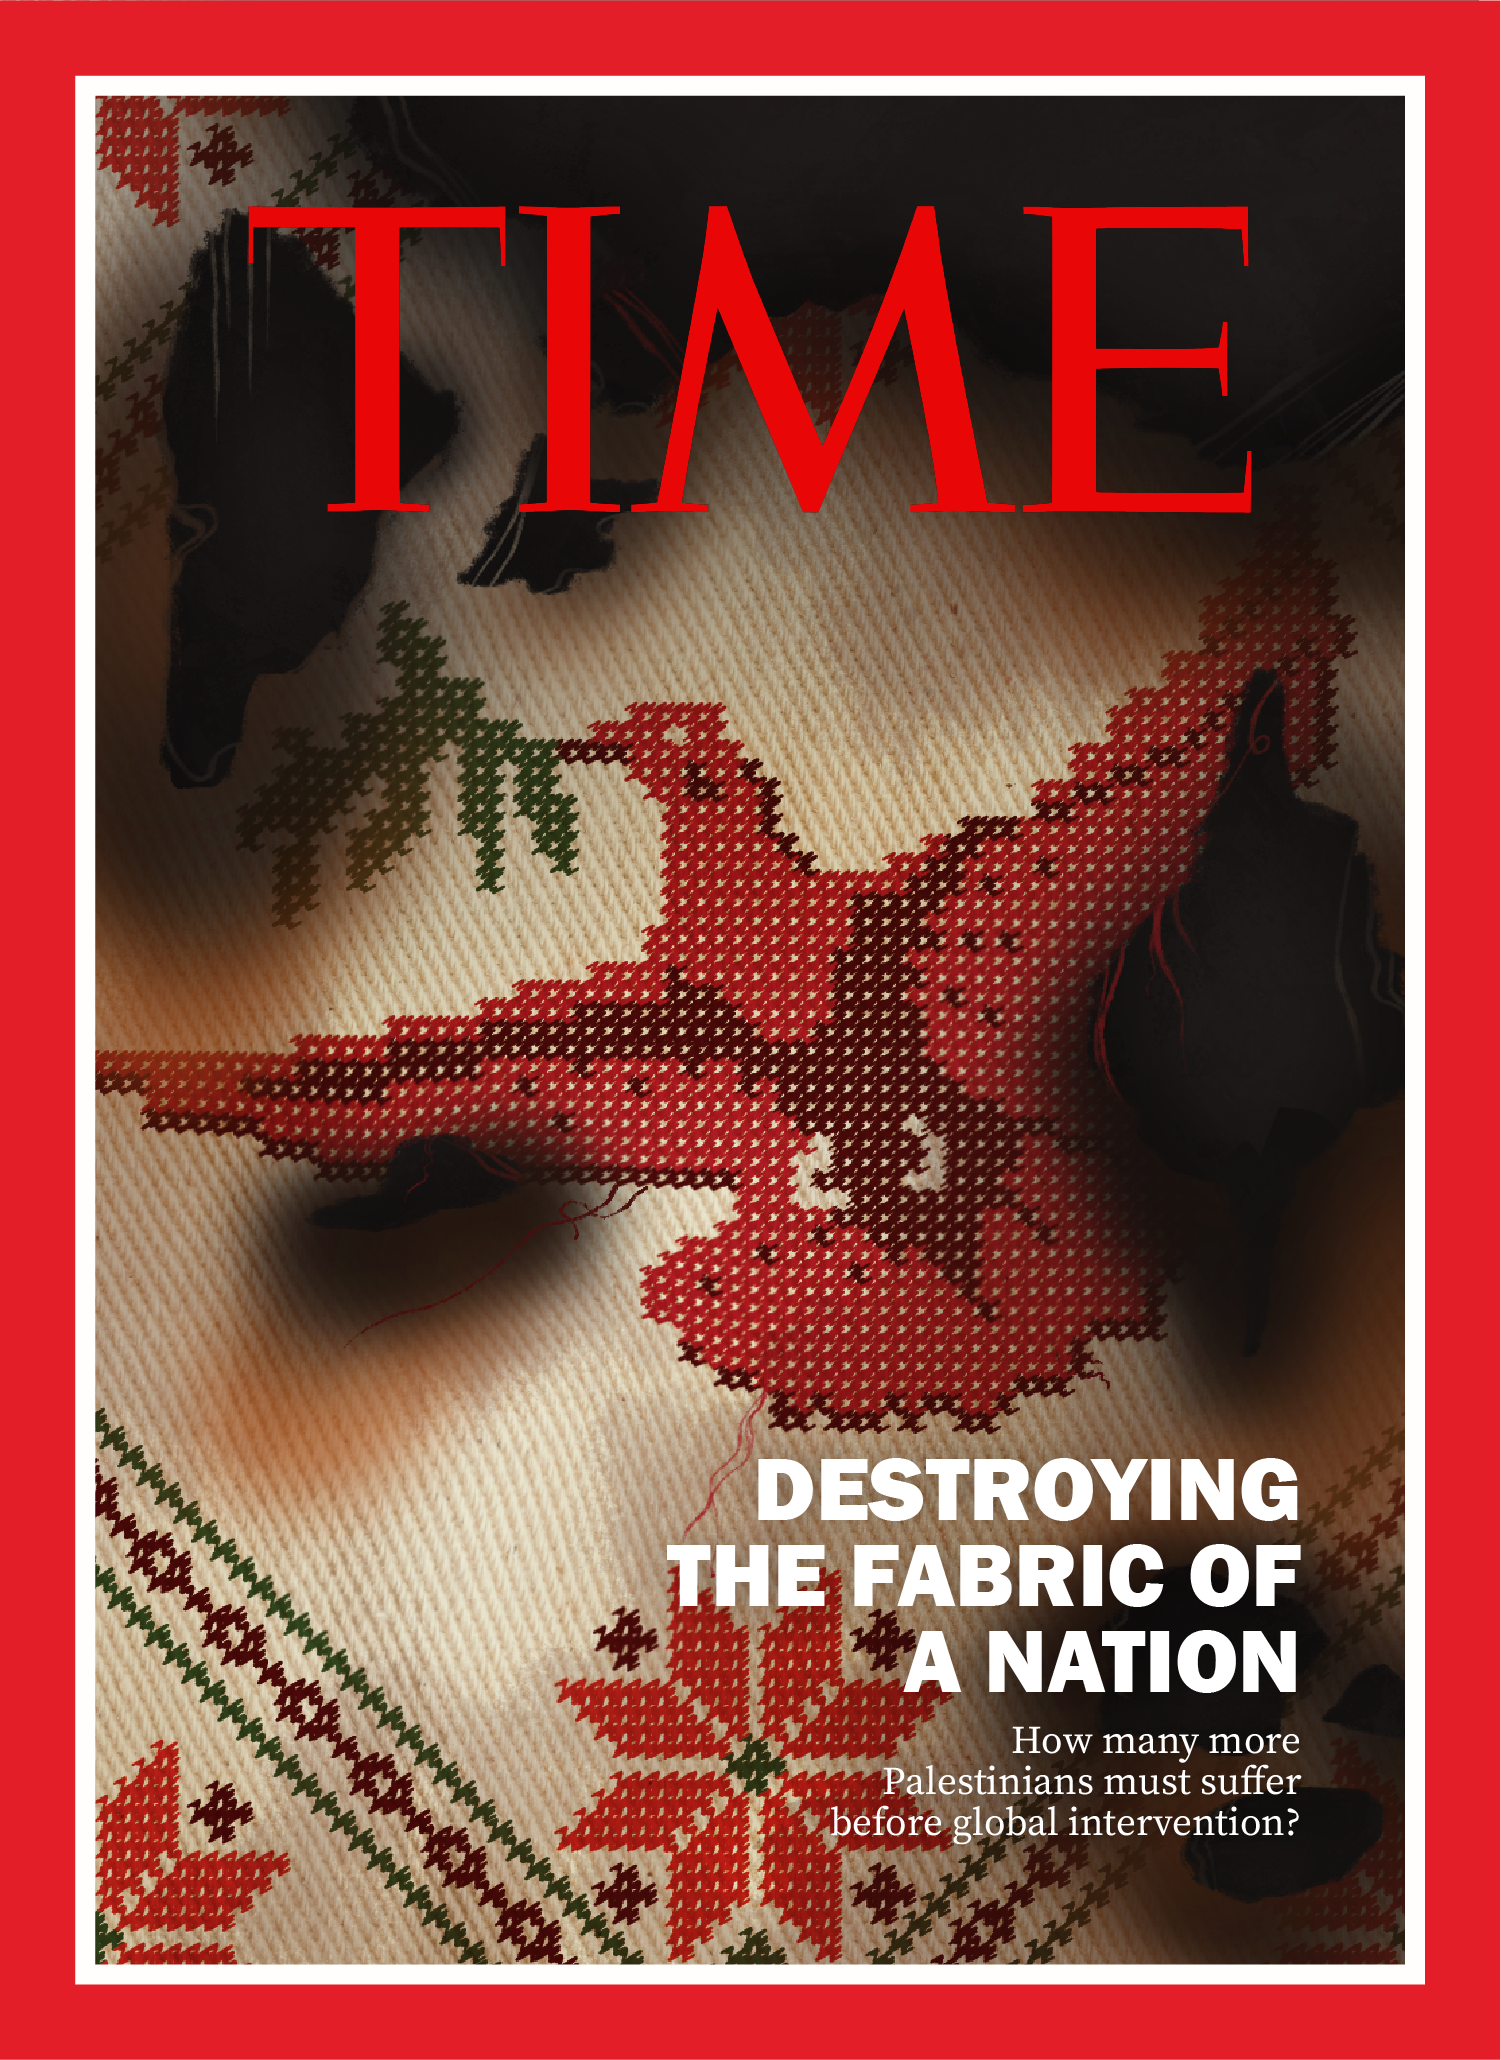
Mock 'TIME' Cover: I created this mock cover about the War in Gaza for my magazine design course. I also created an accompanying internal spread.
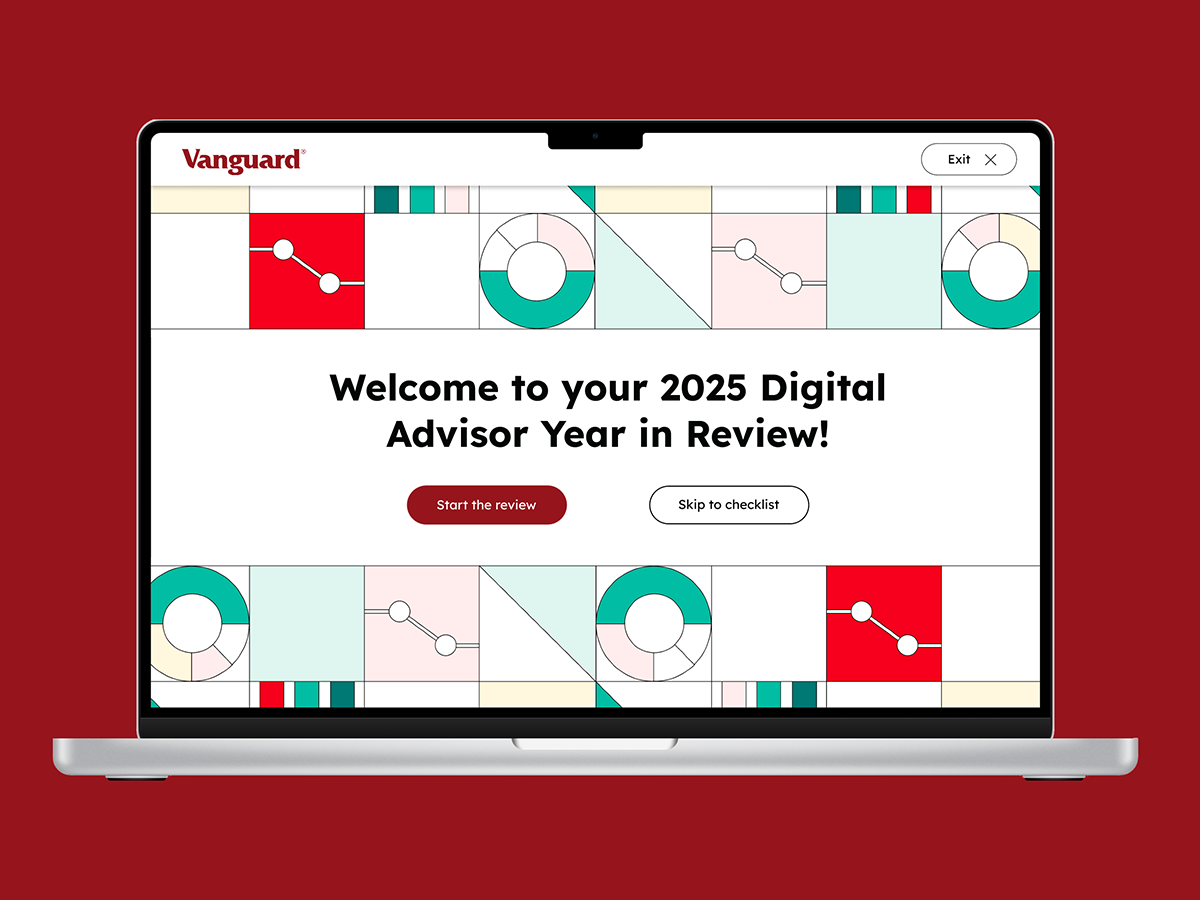
Vanguard YIR: My UX Design course partnered with Vanguard to redesign their Year in Review interface. This was my pitch. Learn more about it at the link below.
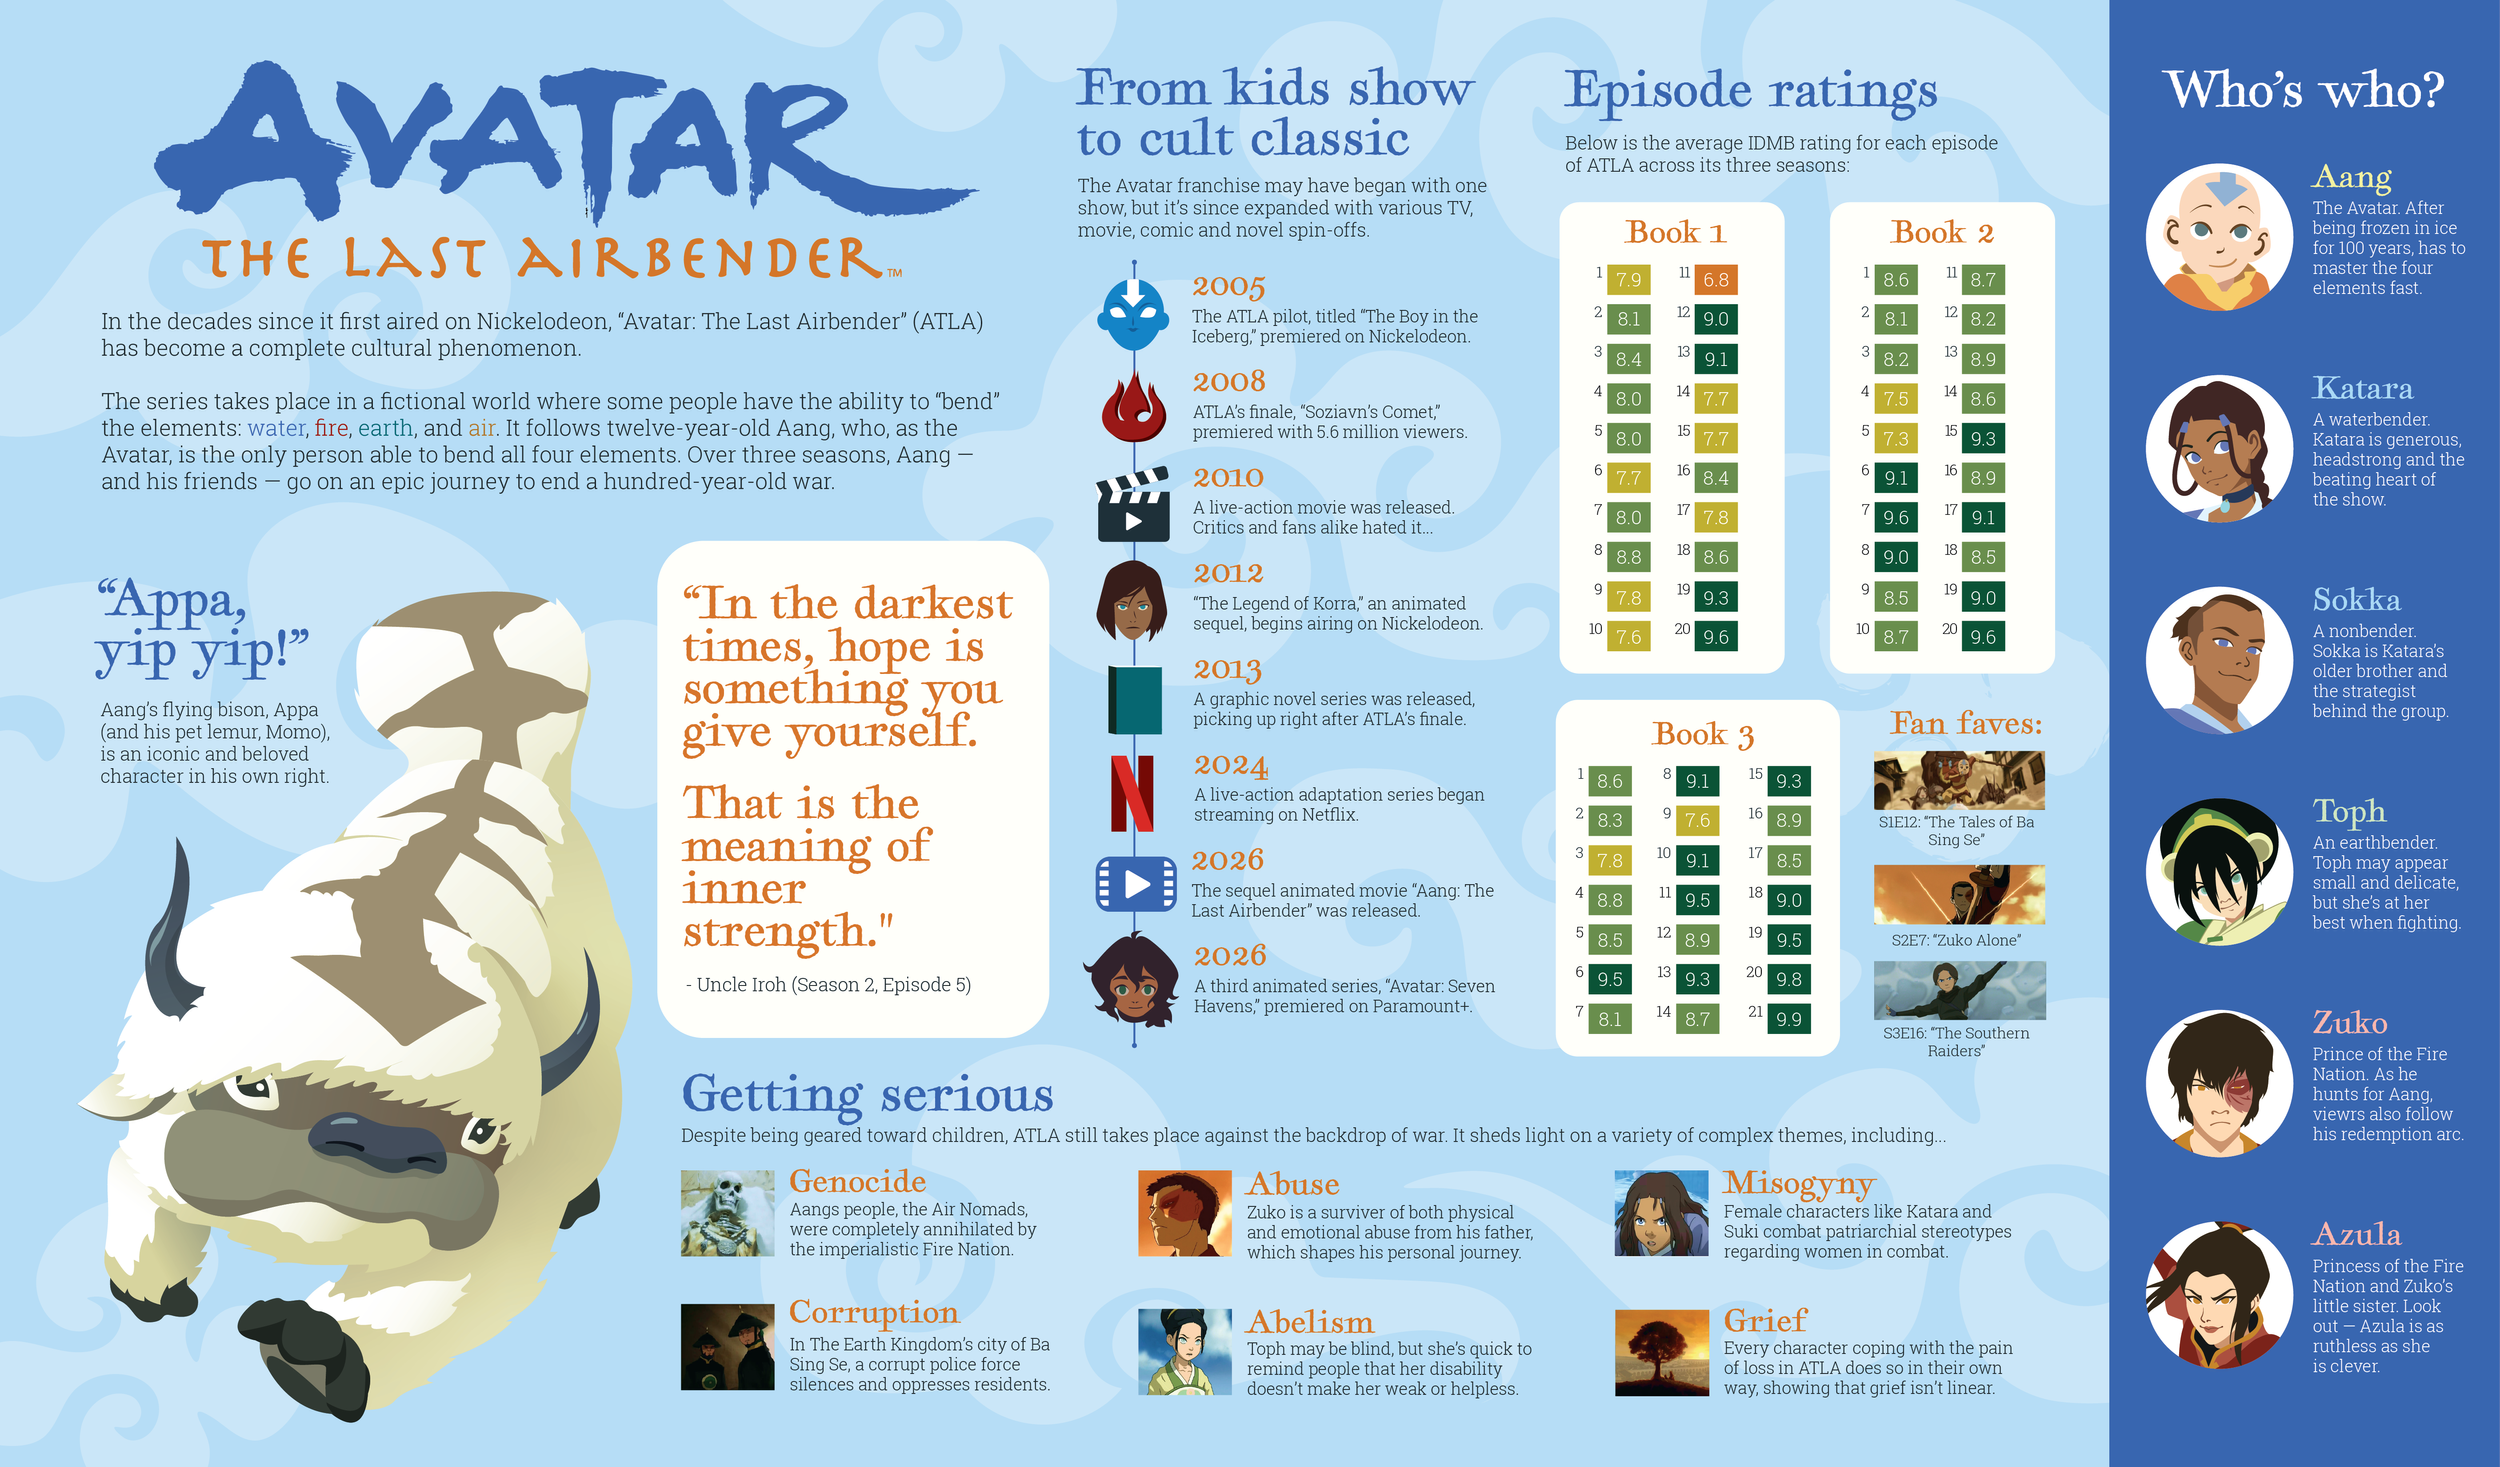
Avatar: The Last Airbender: I created this information graphic as a poster about my favorite childhood show. All illustrations were done in Illustrator.
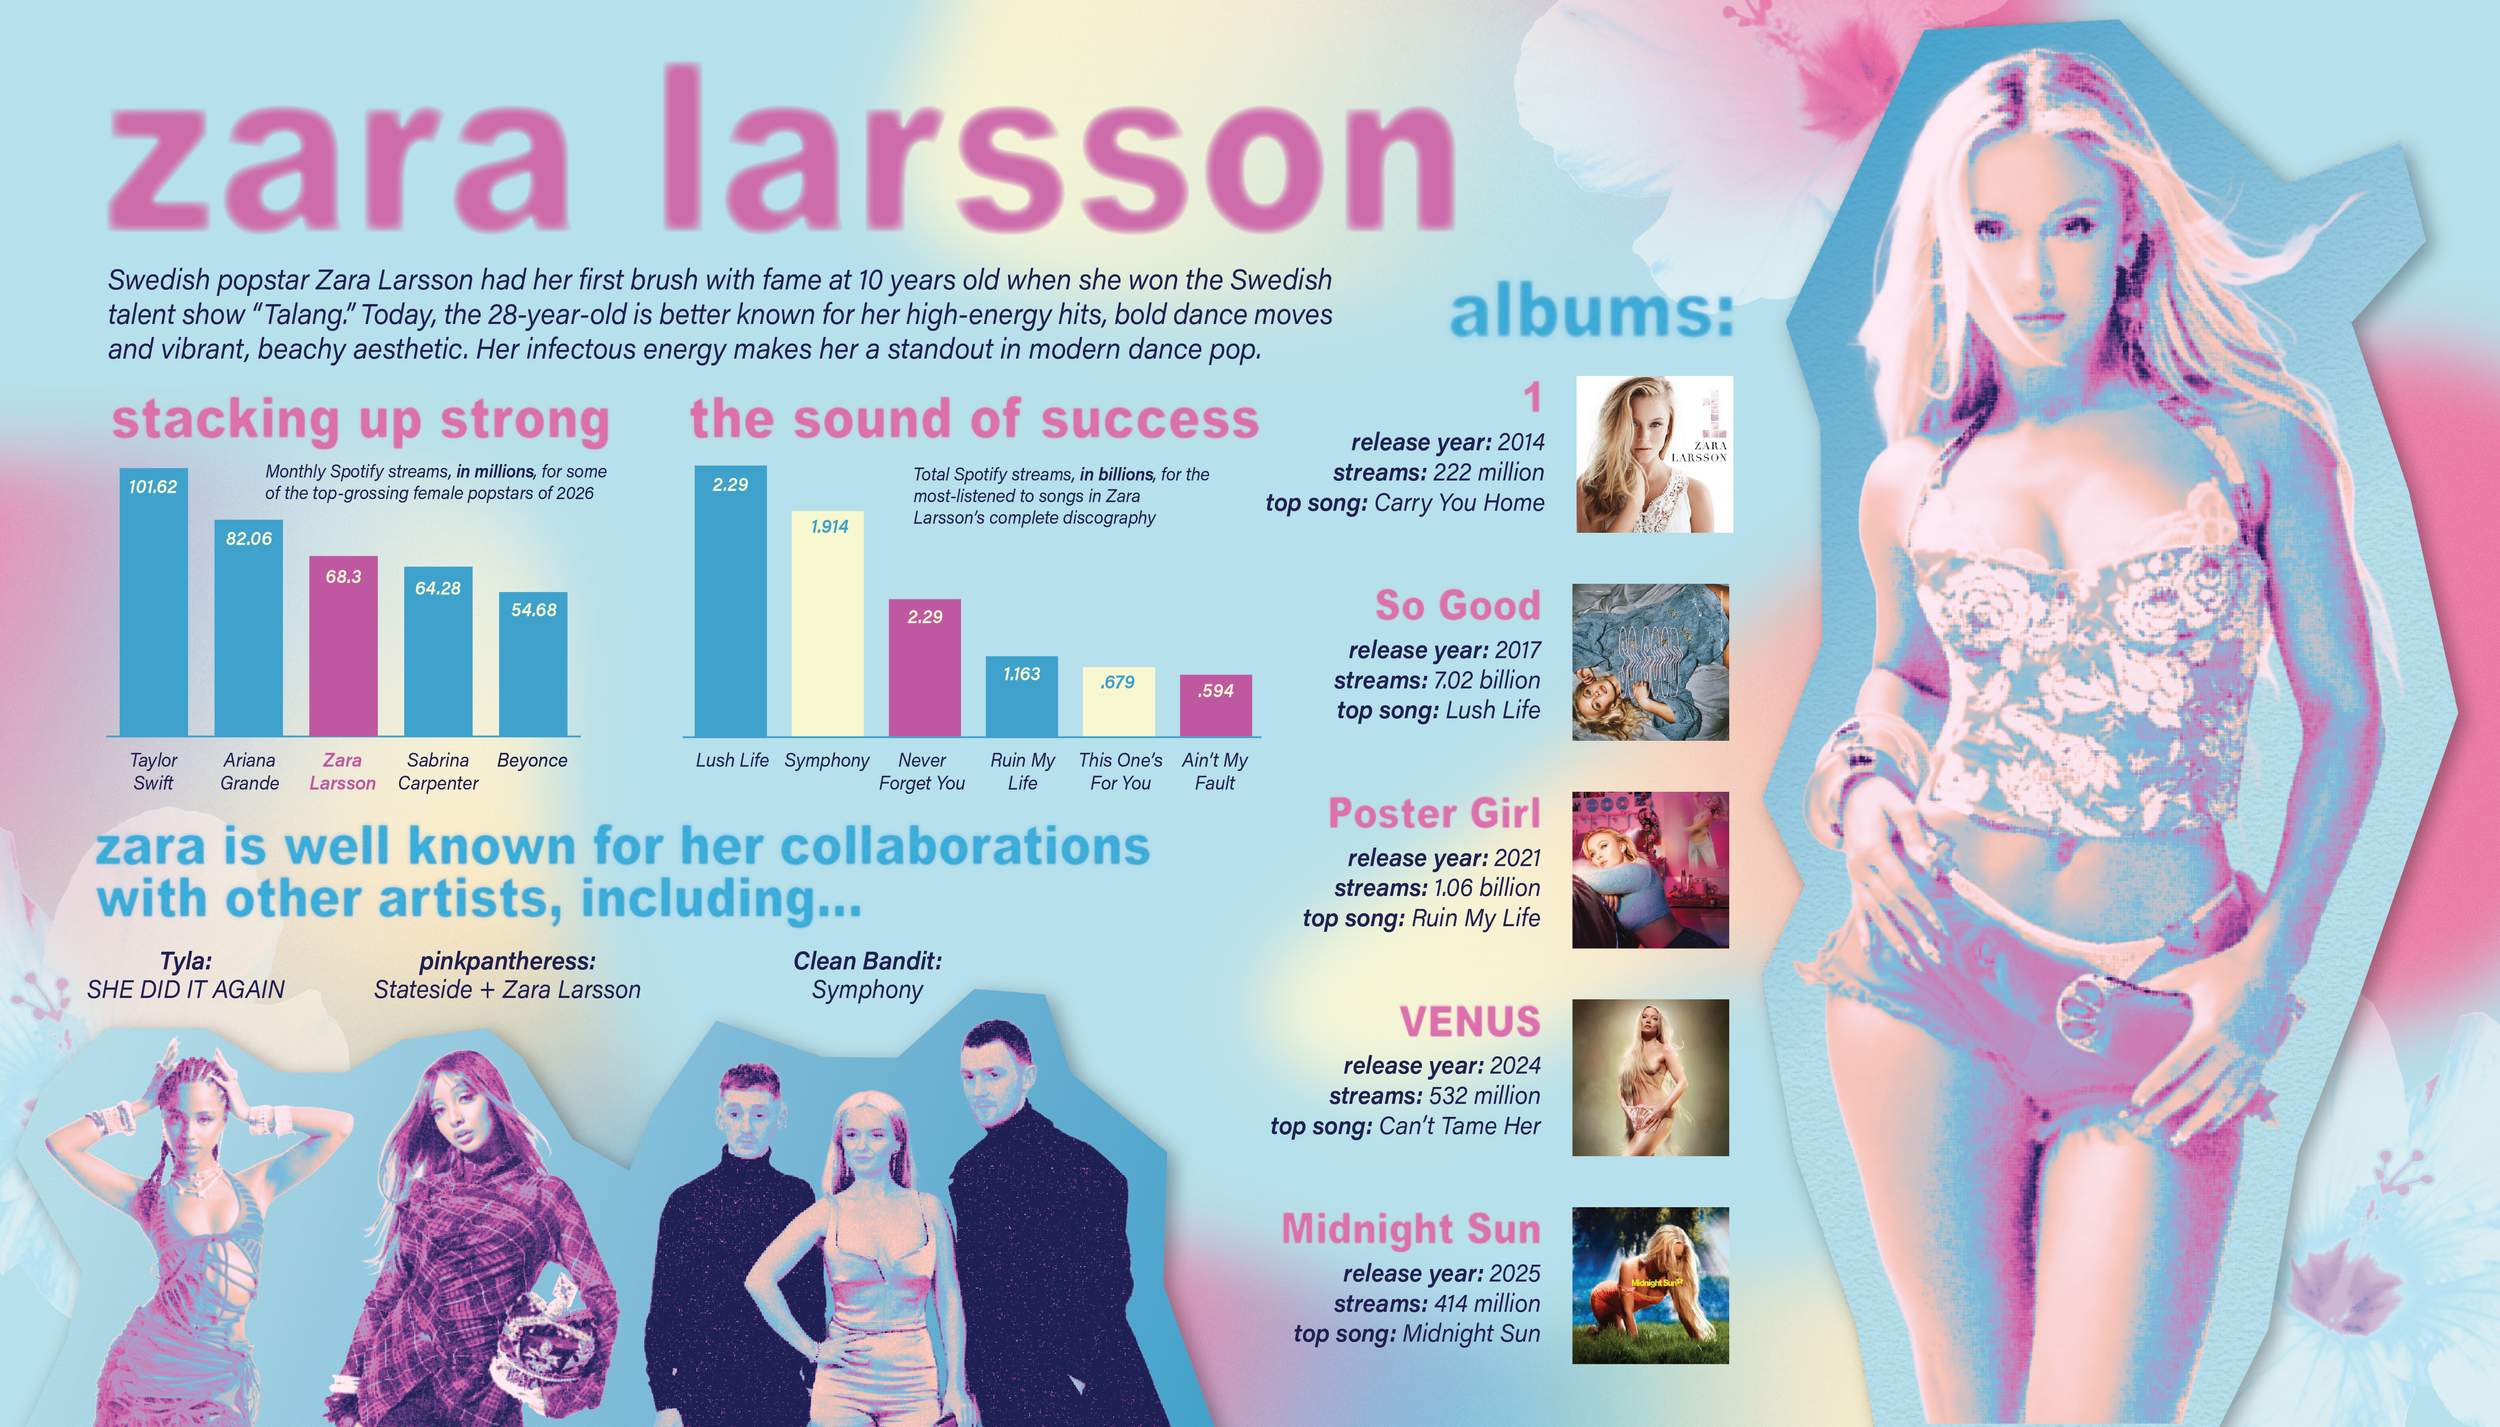
Zara Larsson: This infographic explored using photo editing instead of creating new illustrations. I used Illustrator and Photoshop to create this poster.
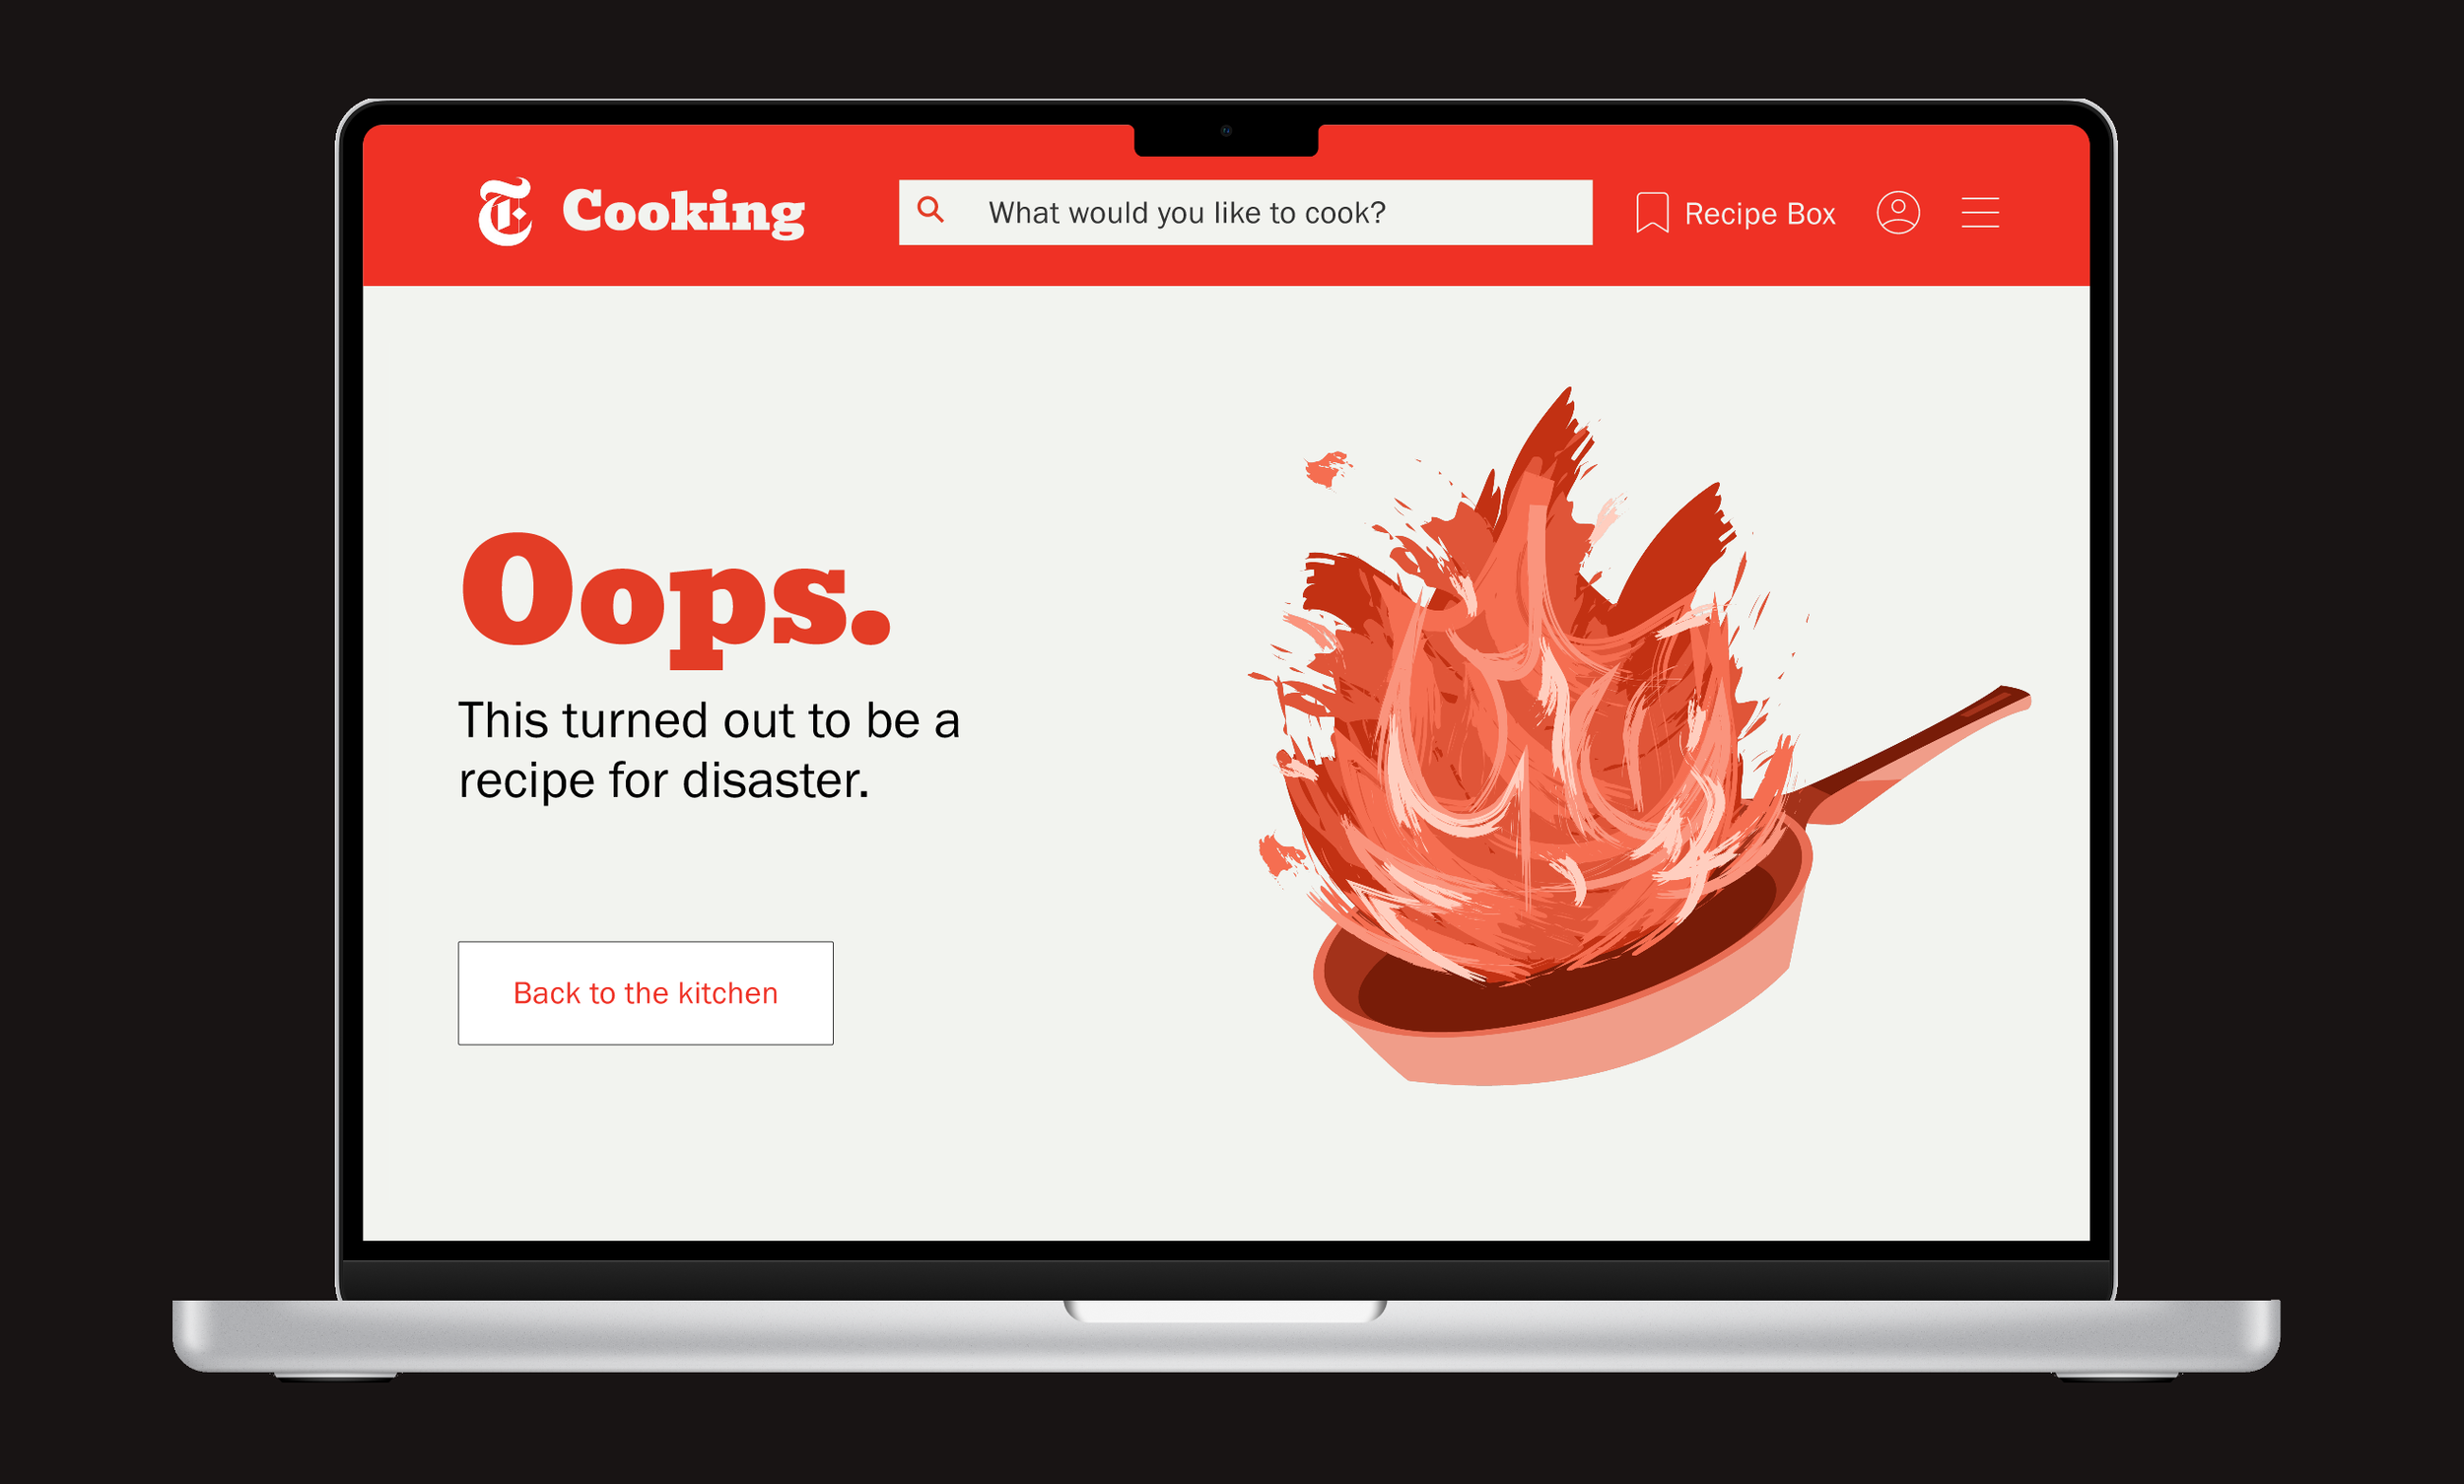
NYT Error Page: As a UX/UI class exercise, I chose to redesign the New York Times Cooking site’s 404 error page. The result is a dynamic, responsive and humorous addition to the site’s established branding. View the prototype at the link.
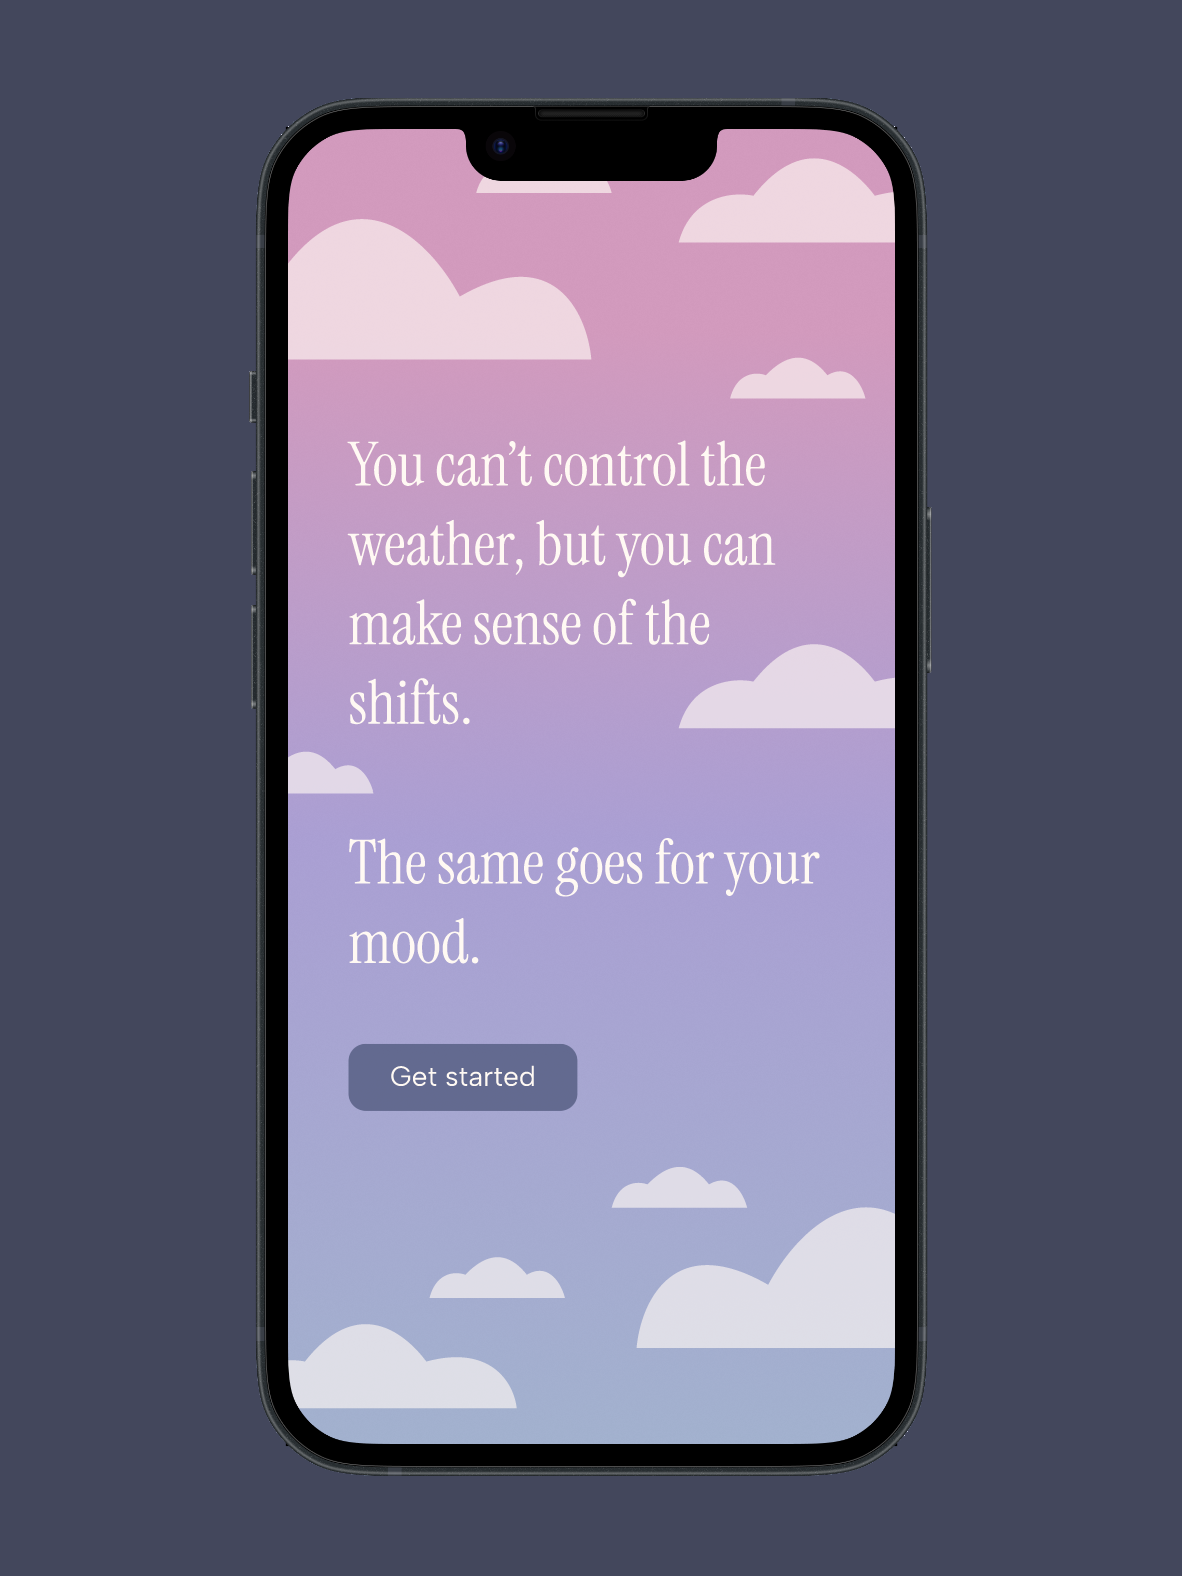
Mood Tracking App: I designed this mood tracker app prototype on Figma for my UX Design course. Click through it at the link.
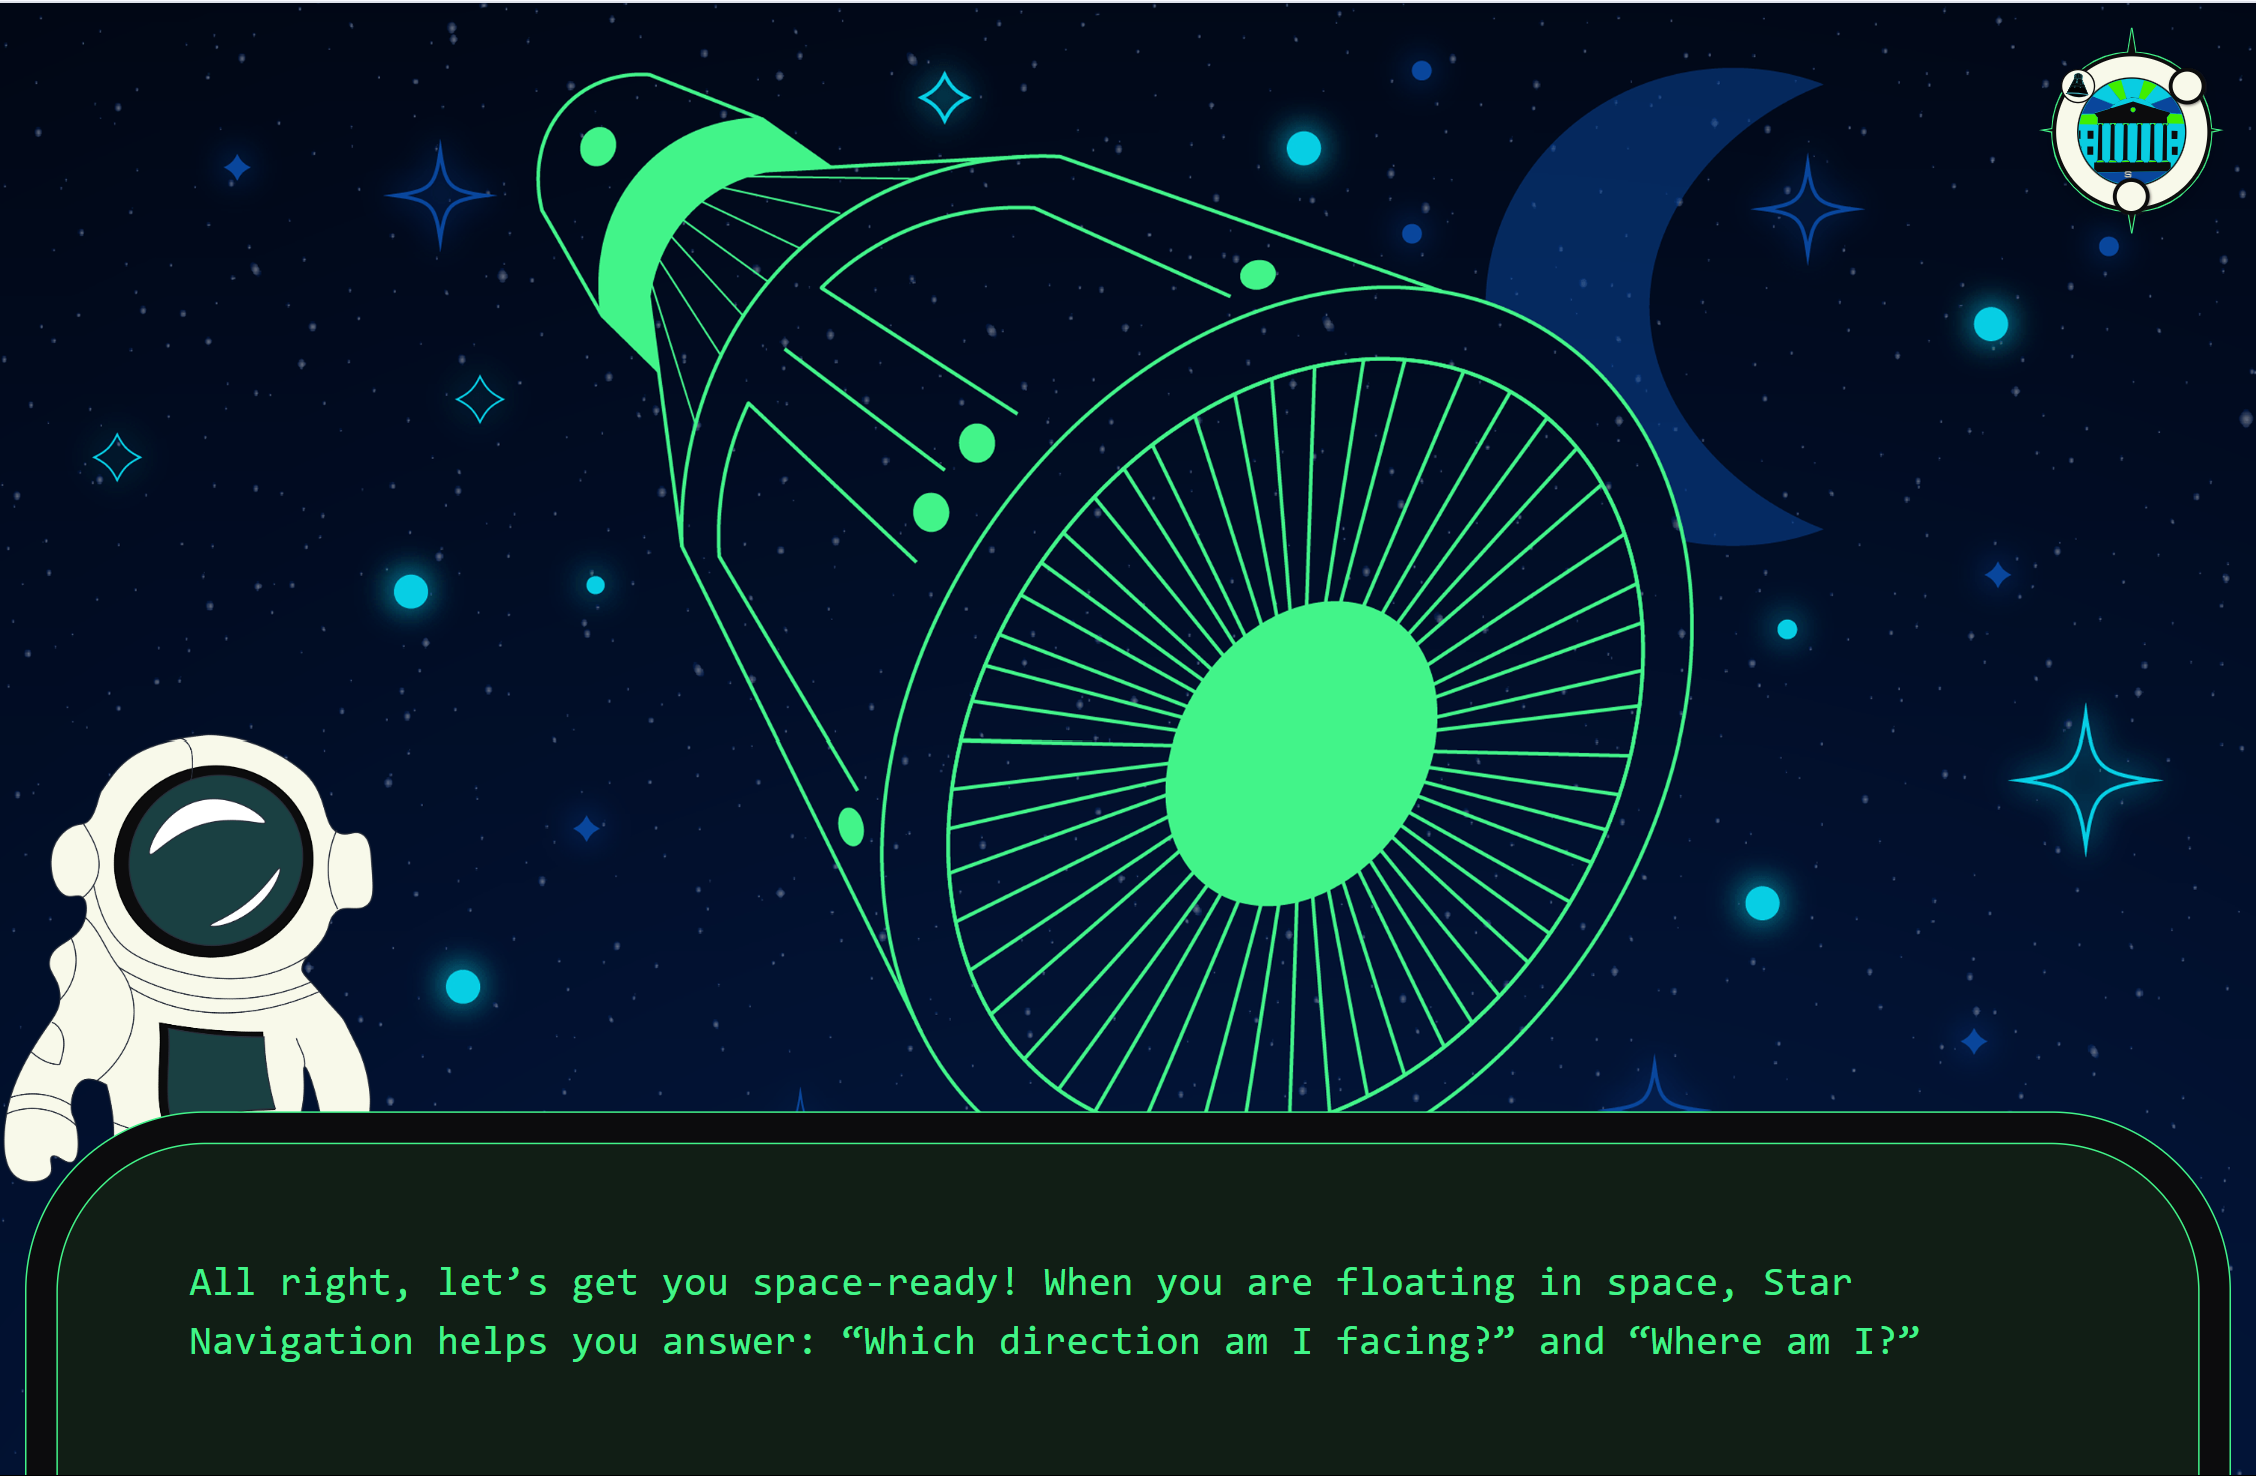
Cookie Time Confidential: I designed assets and flows for this playable game, designed to teach children about astronaut training. More details to come.
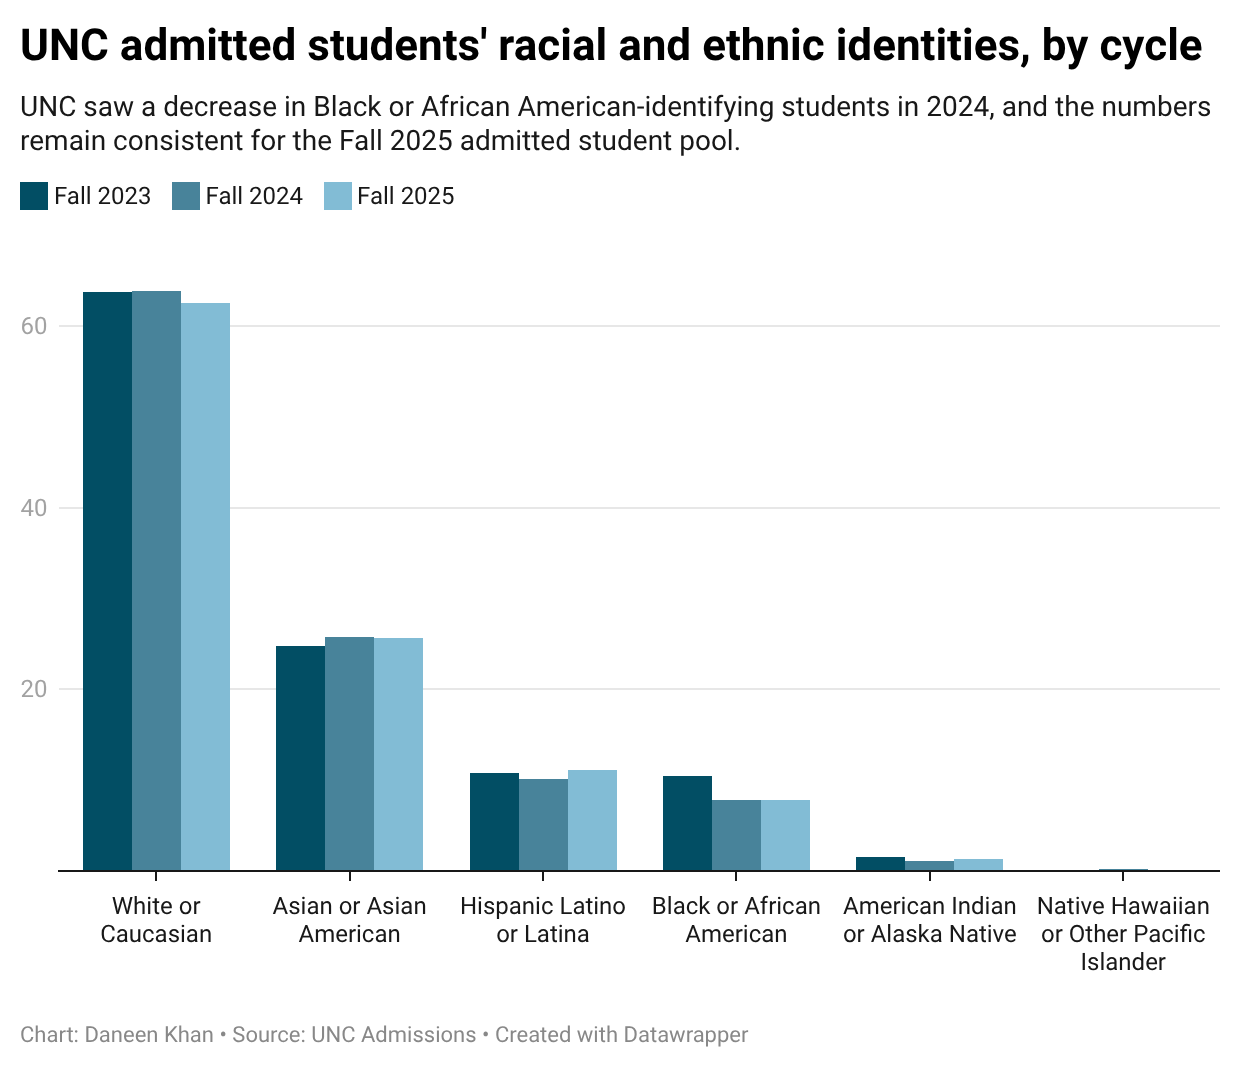
UNC Admit Demographics: I created this stacked bar chart on Datawrapper to compare how UNC students identify in admission cycles after the repeal of affirmative action.
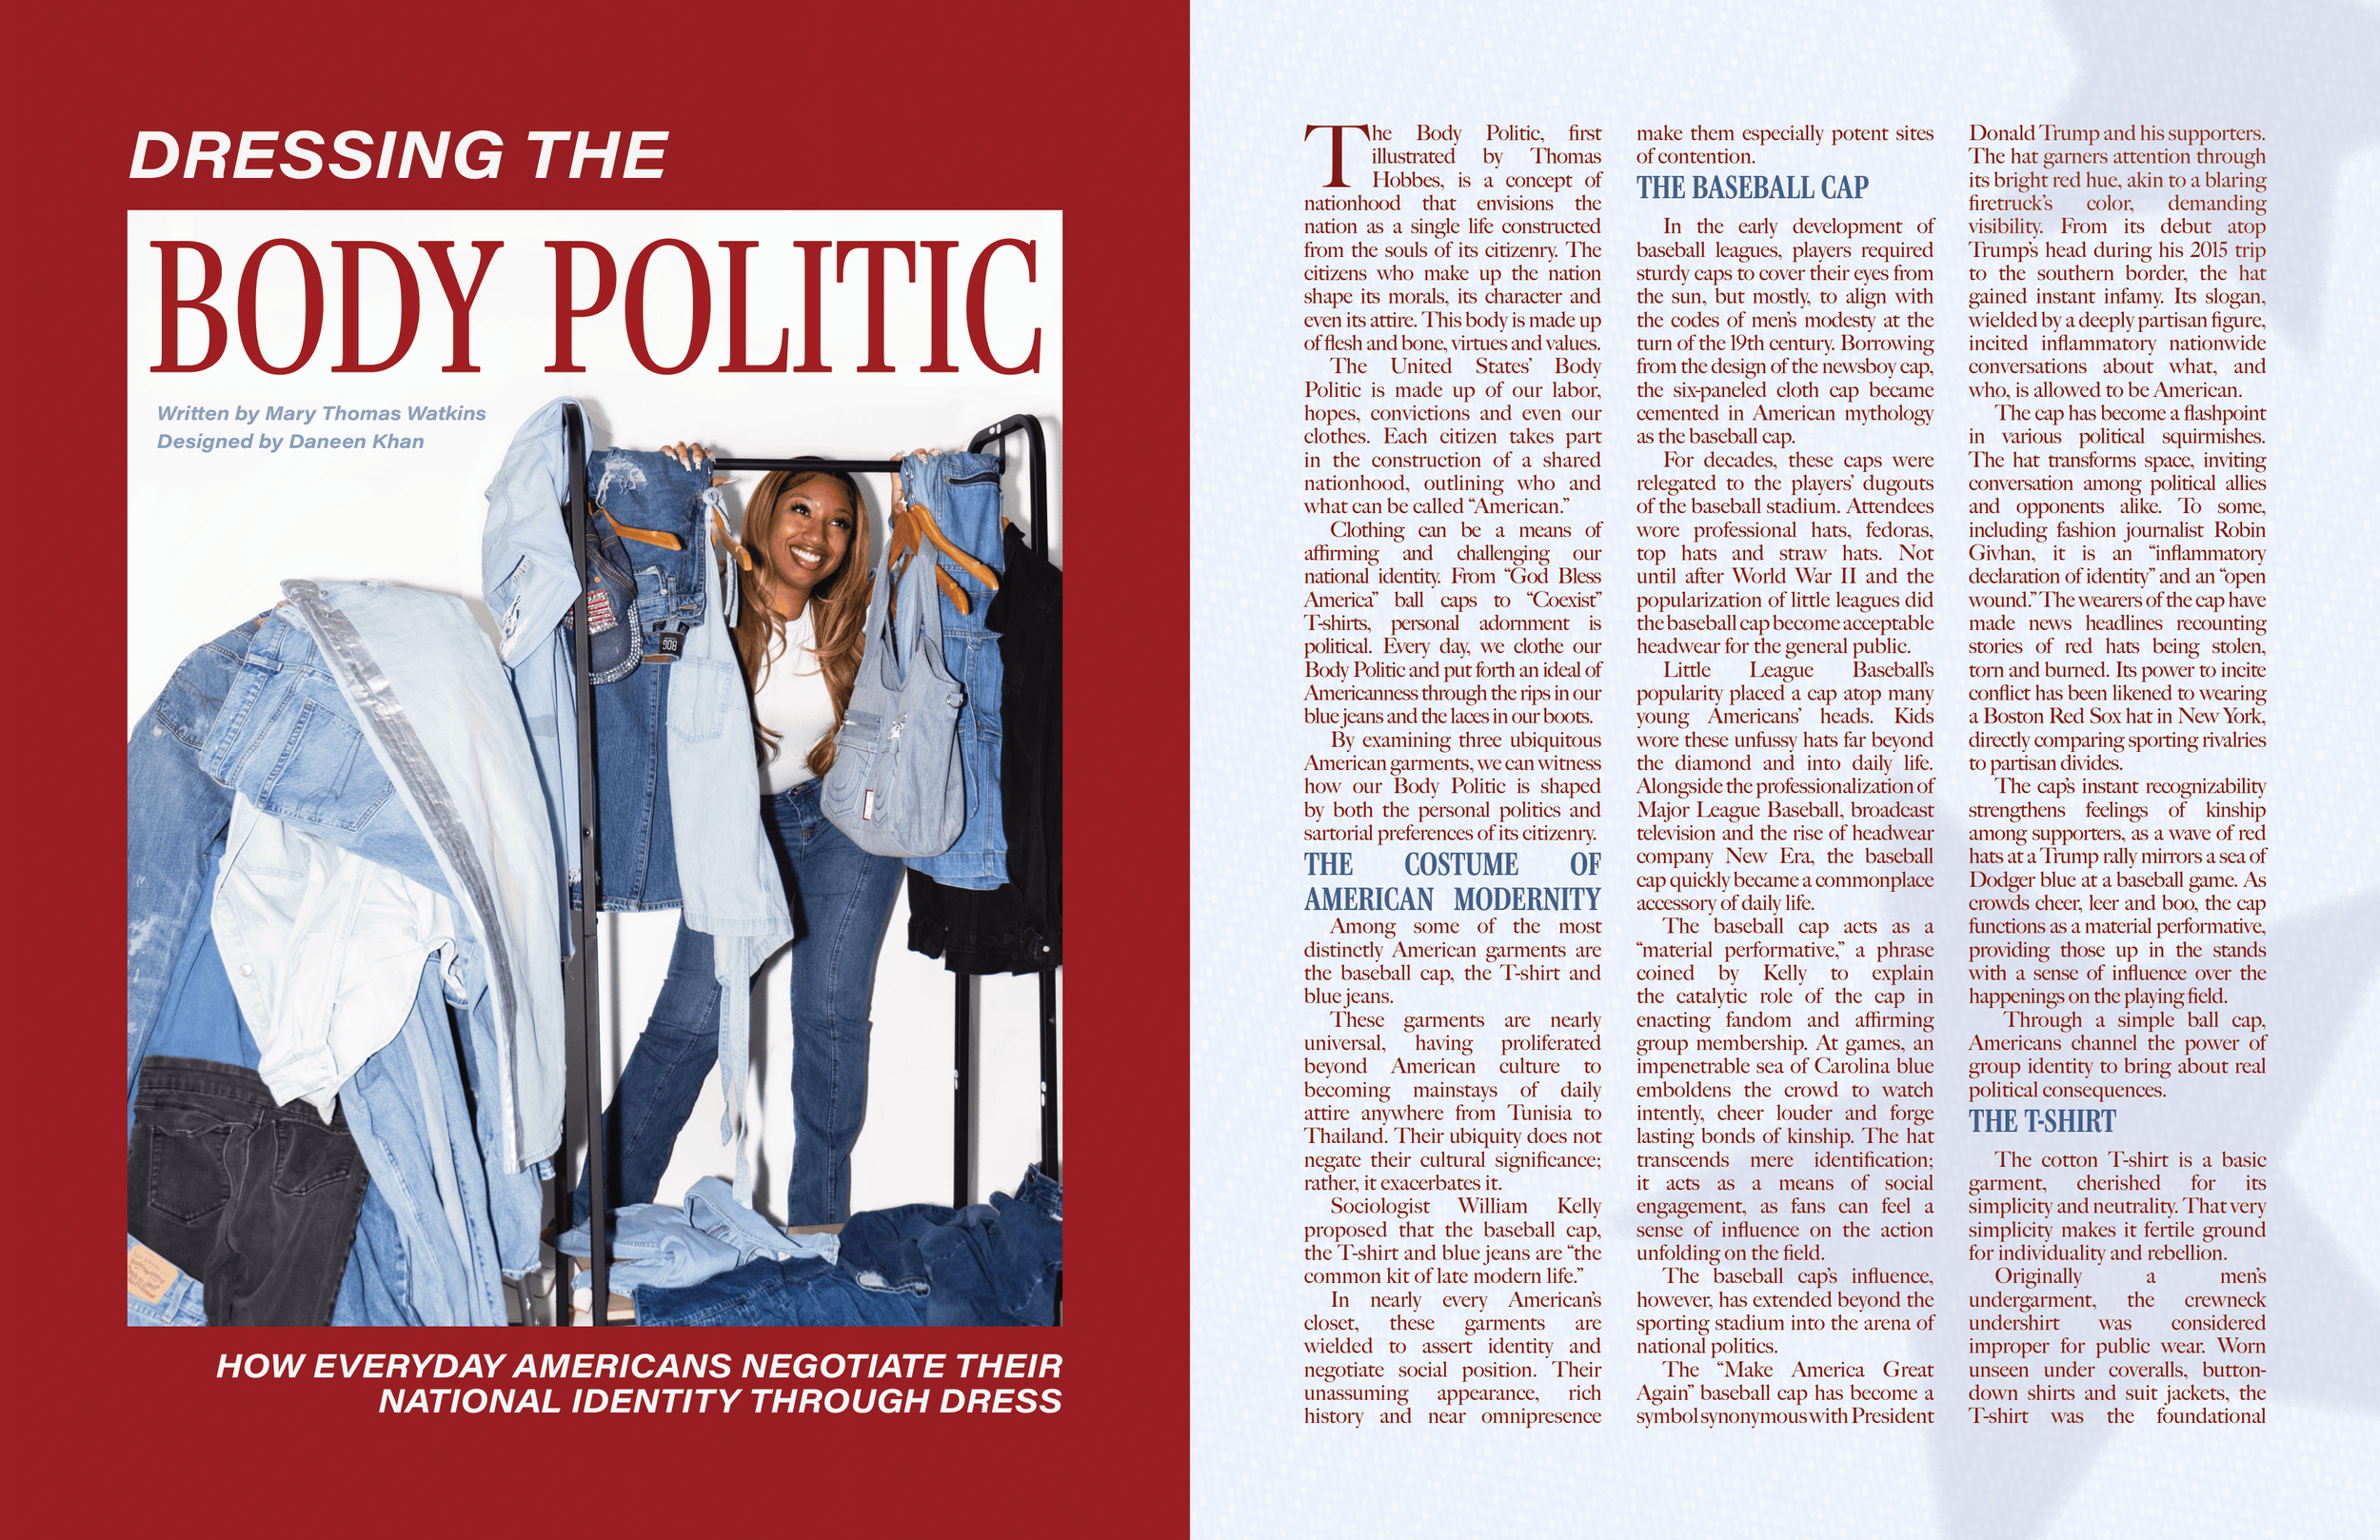
Dressing the Body Politic: I created this spread for Coulture Magazine, UNC's student fashion publication, on Adobe InDesign.
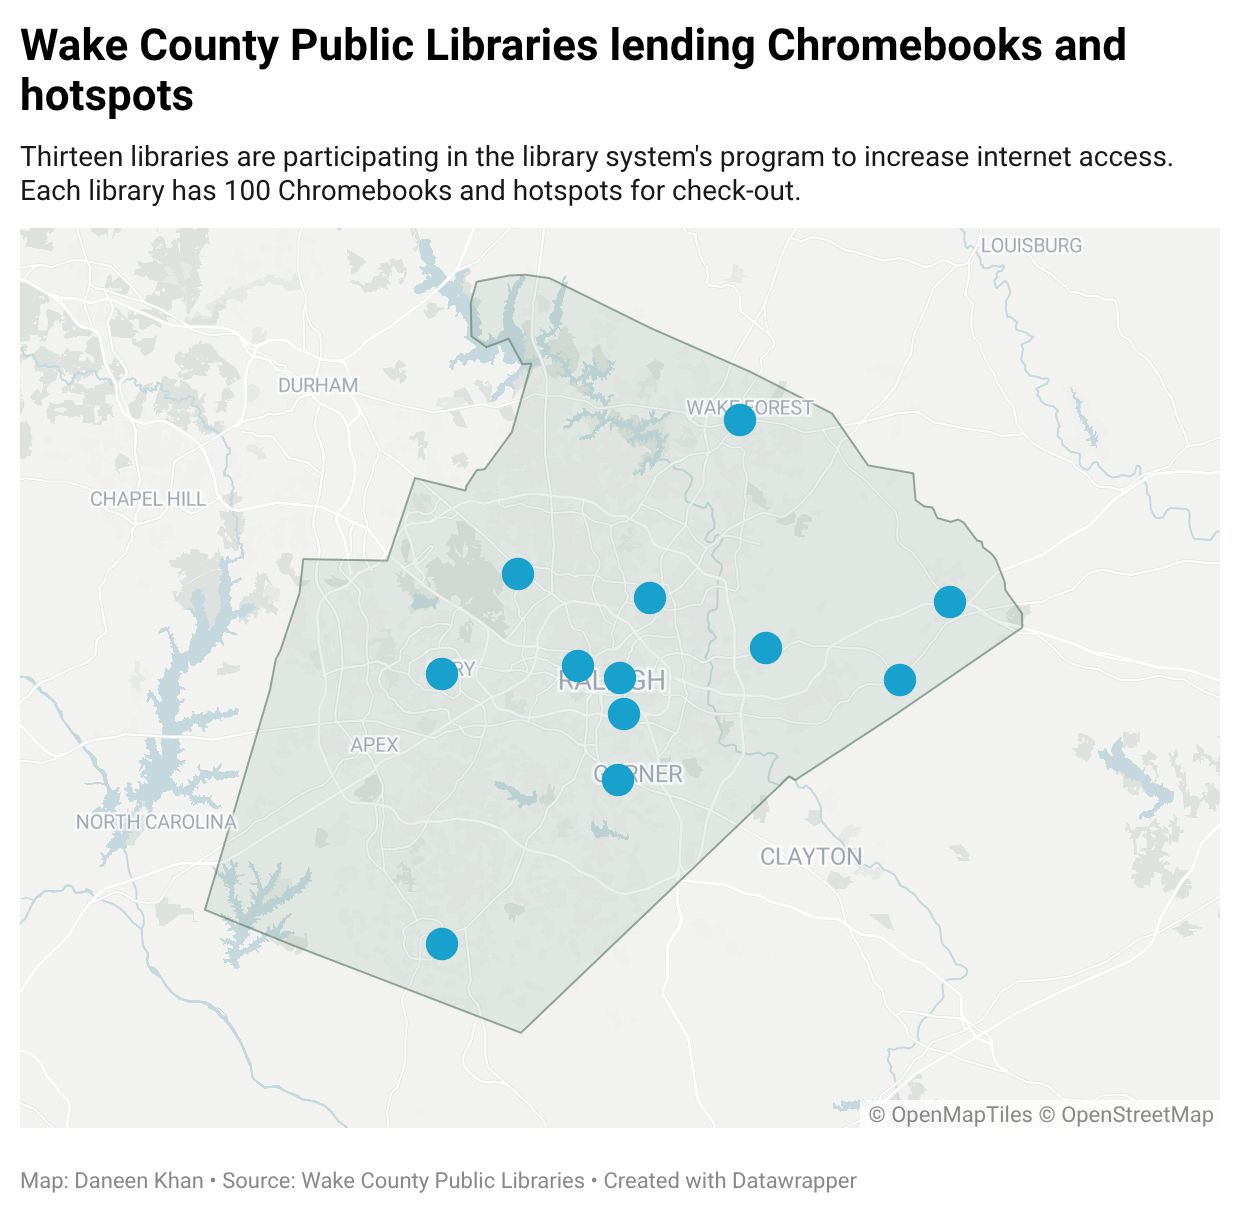
Library Chromebook Program: I created this simple map to accompany an article I wrote about a new Chromebook lending program in the Wake County Library System.
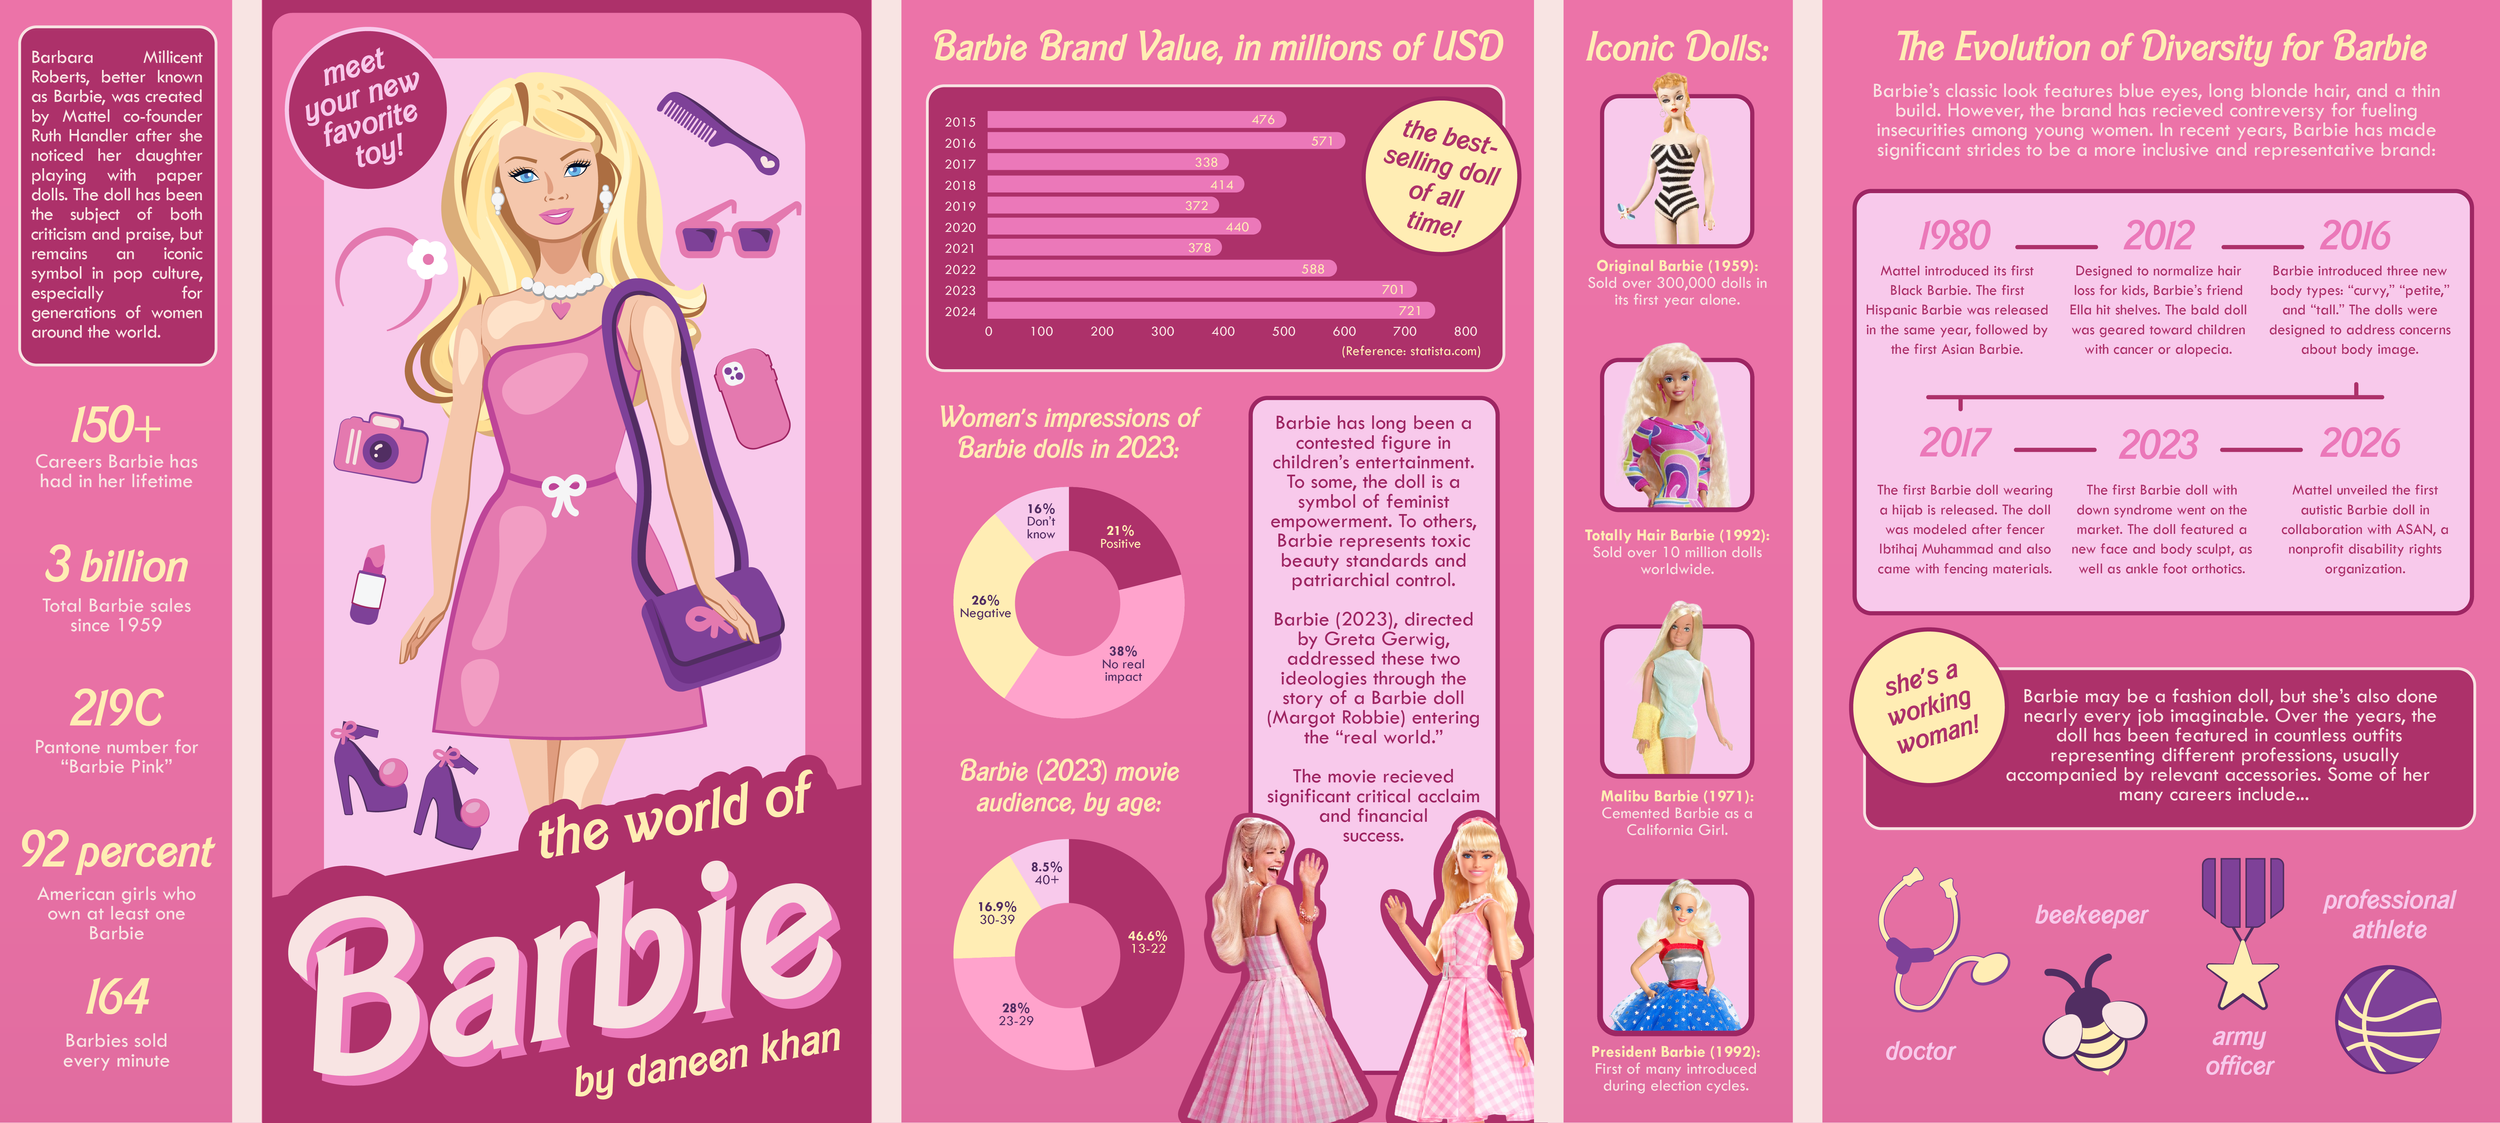
The World of Barbie: This infographic was designed in Illustrator and Photoshop. It received an award of excellence from the Society for News Design.

DTH Graphics: This was one of a handful of graphics I created for The Daily Tar Heel. Though my primary role with the paper was to write, I created a few graphics and illustrations when designers failed to meet deadline.
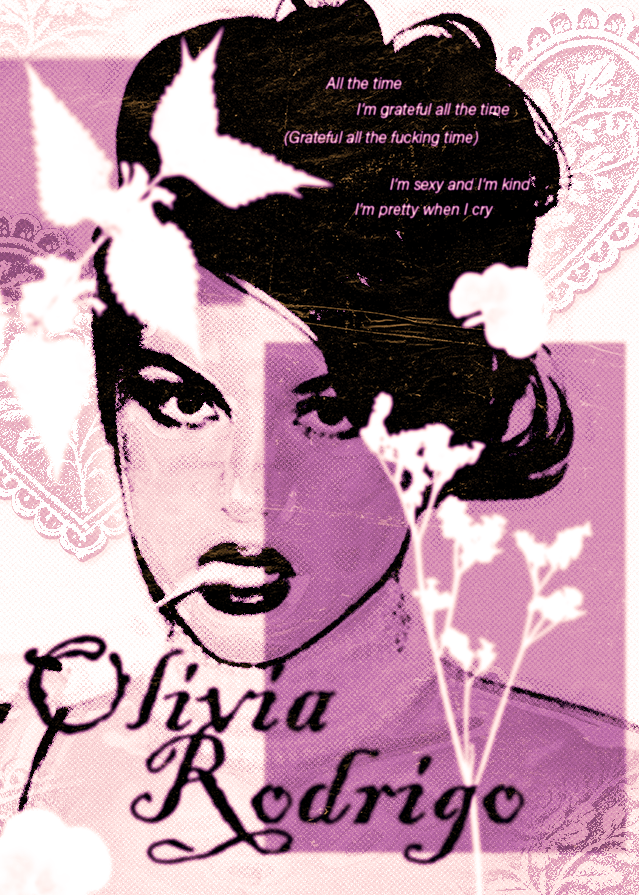
Oliva Rodrigo Poster: I created this artist poster to experiment with overlays and effects on Photoshop.
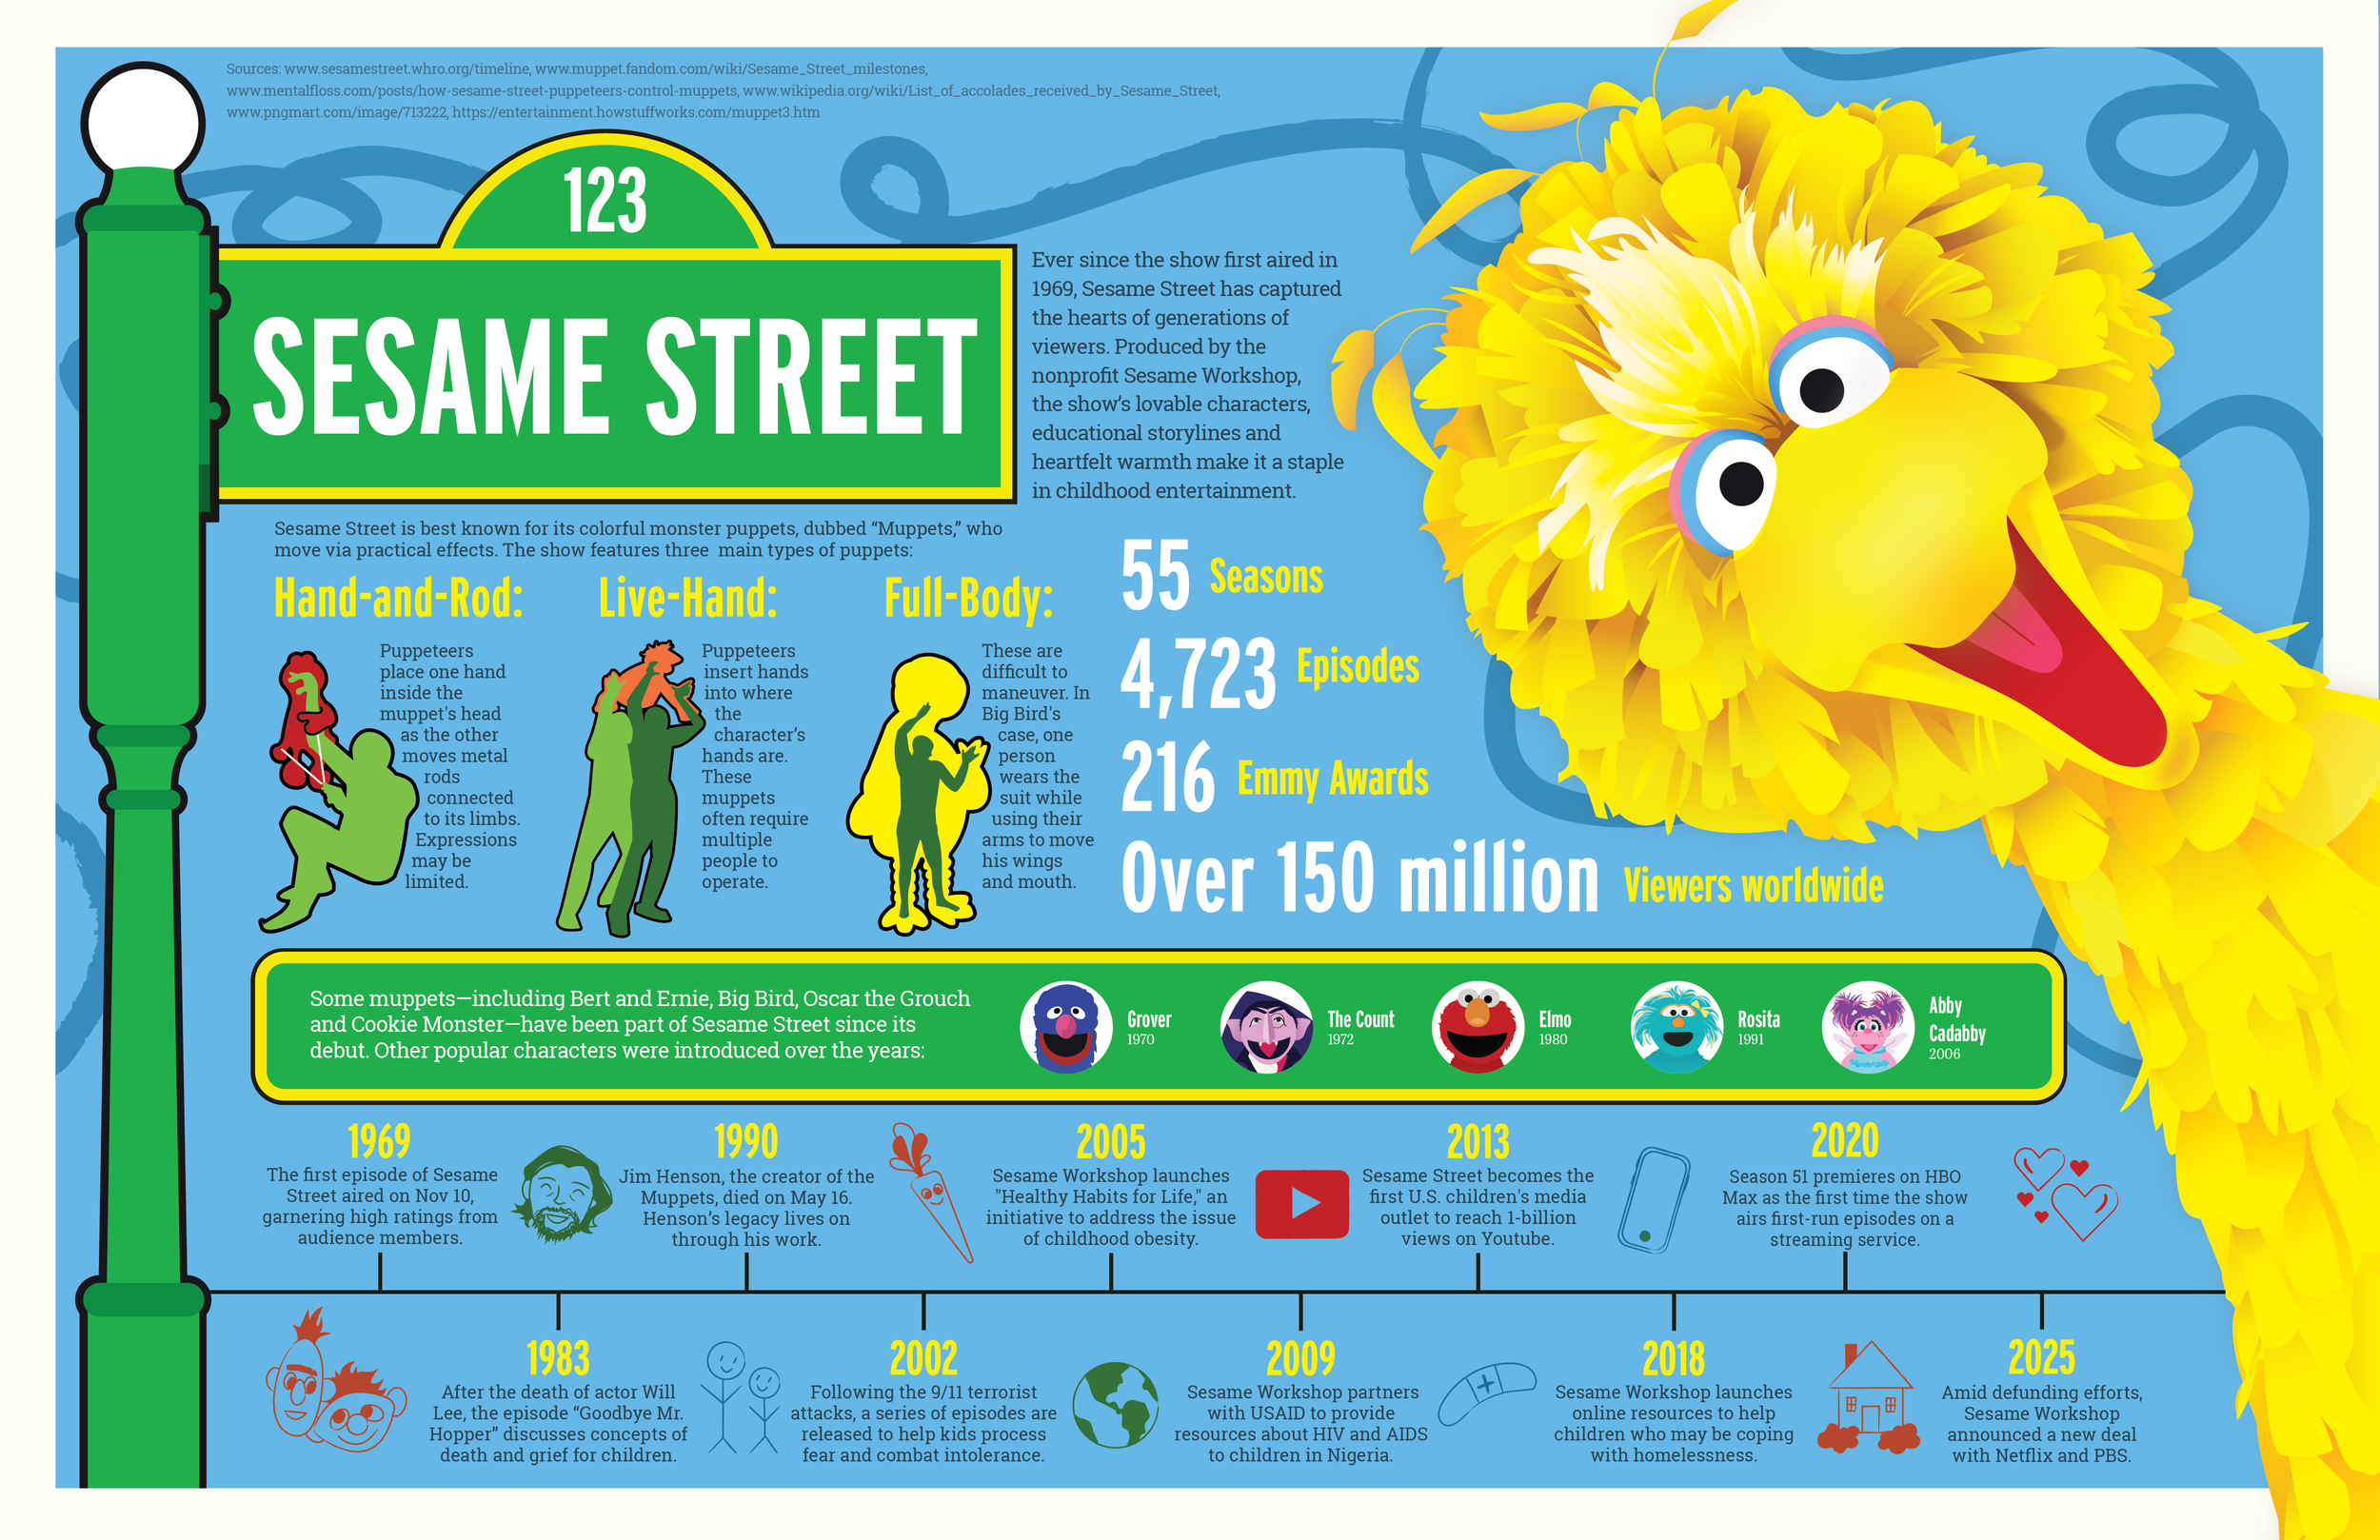
123 Sesame Street: I used Adobe Illustrator to create this infographic about the history and mechanics of Sesame Street, one of my favorite childhood shows.
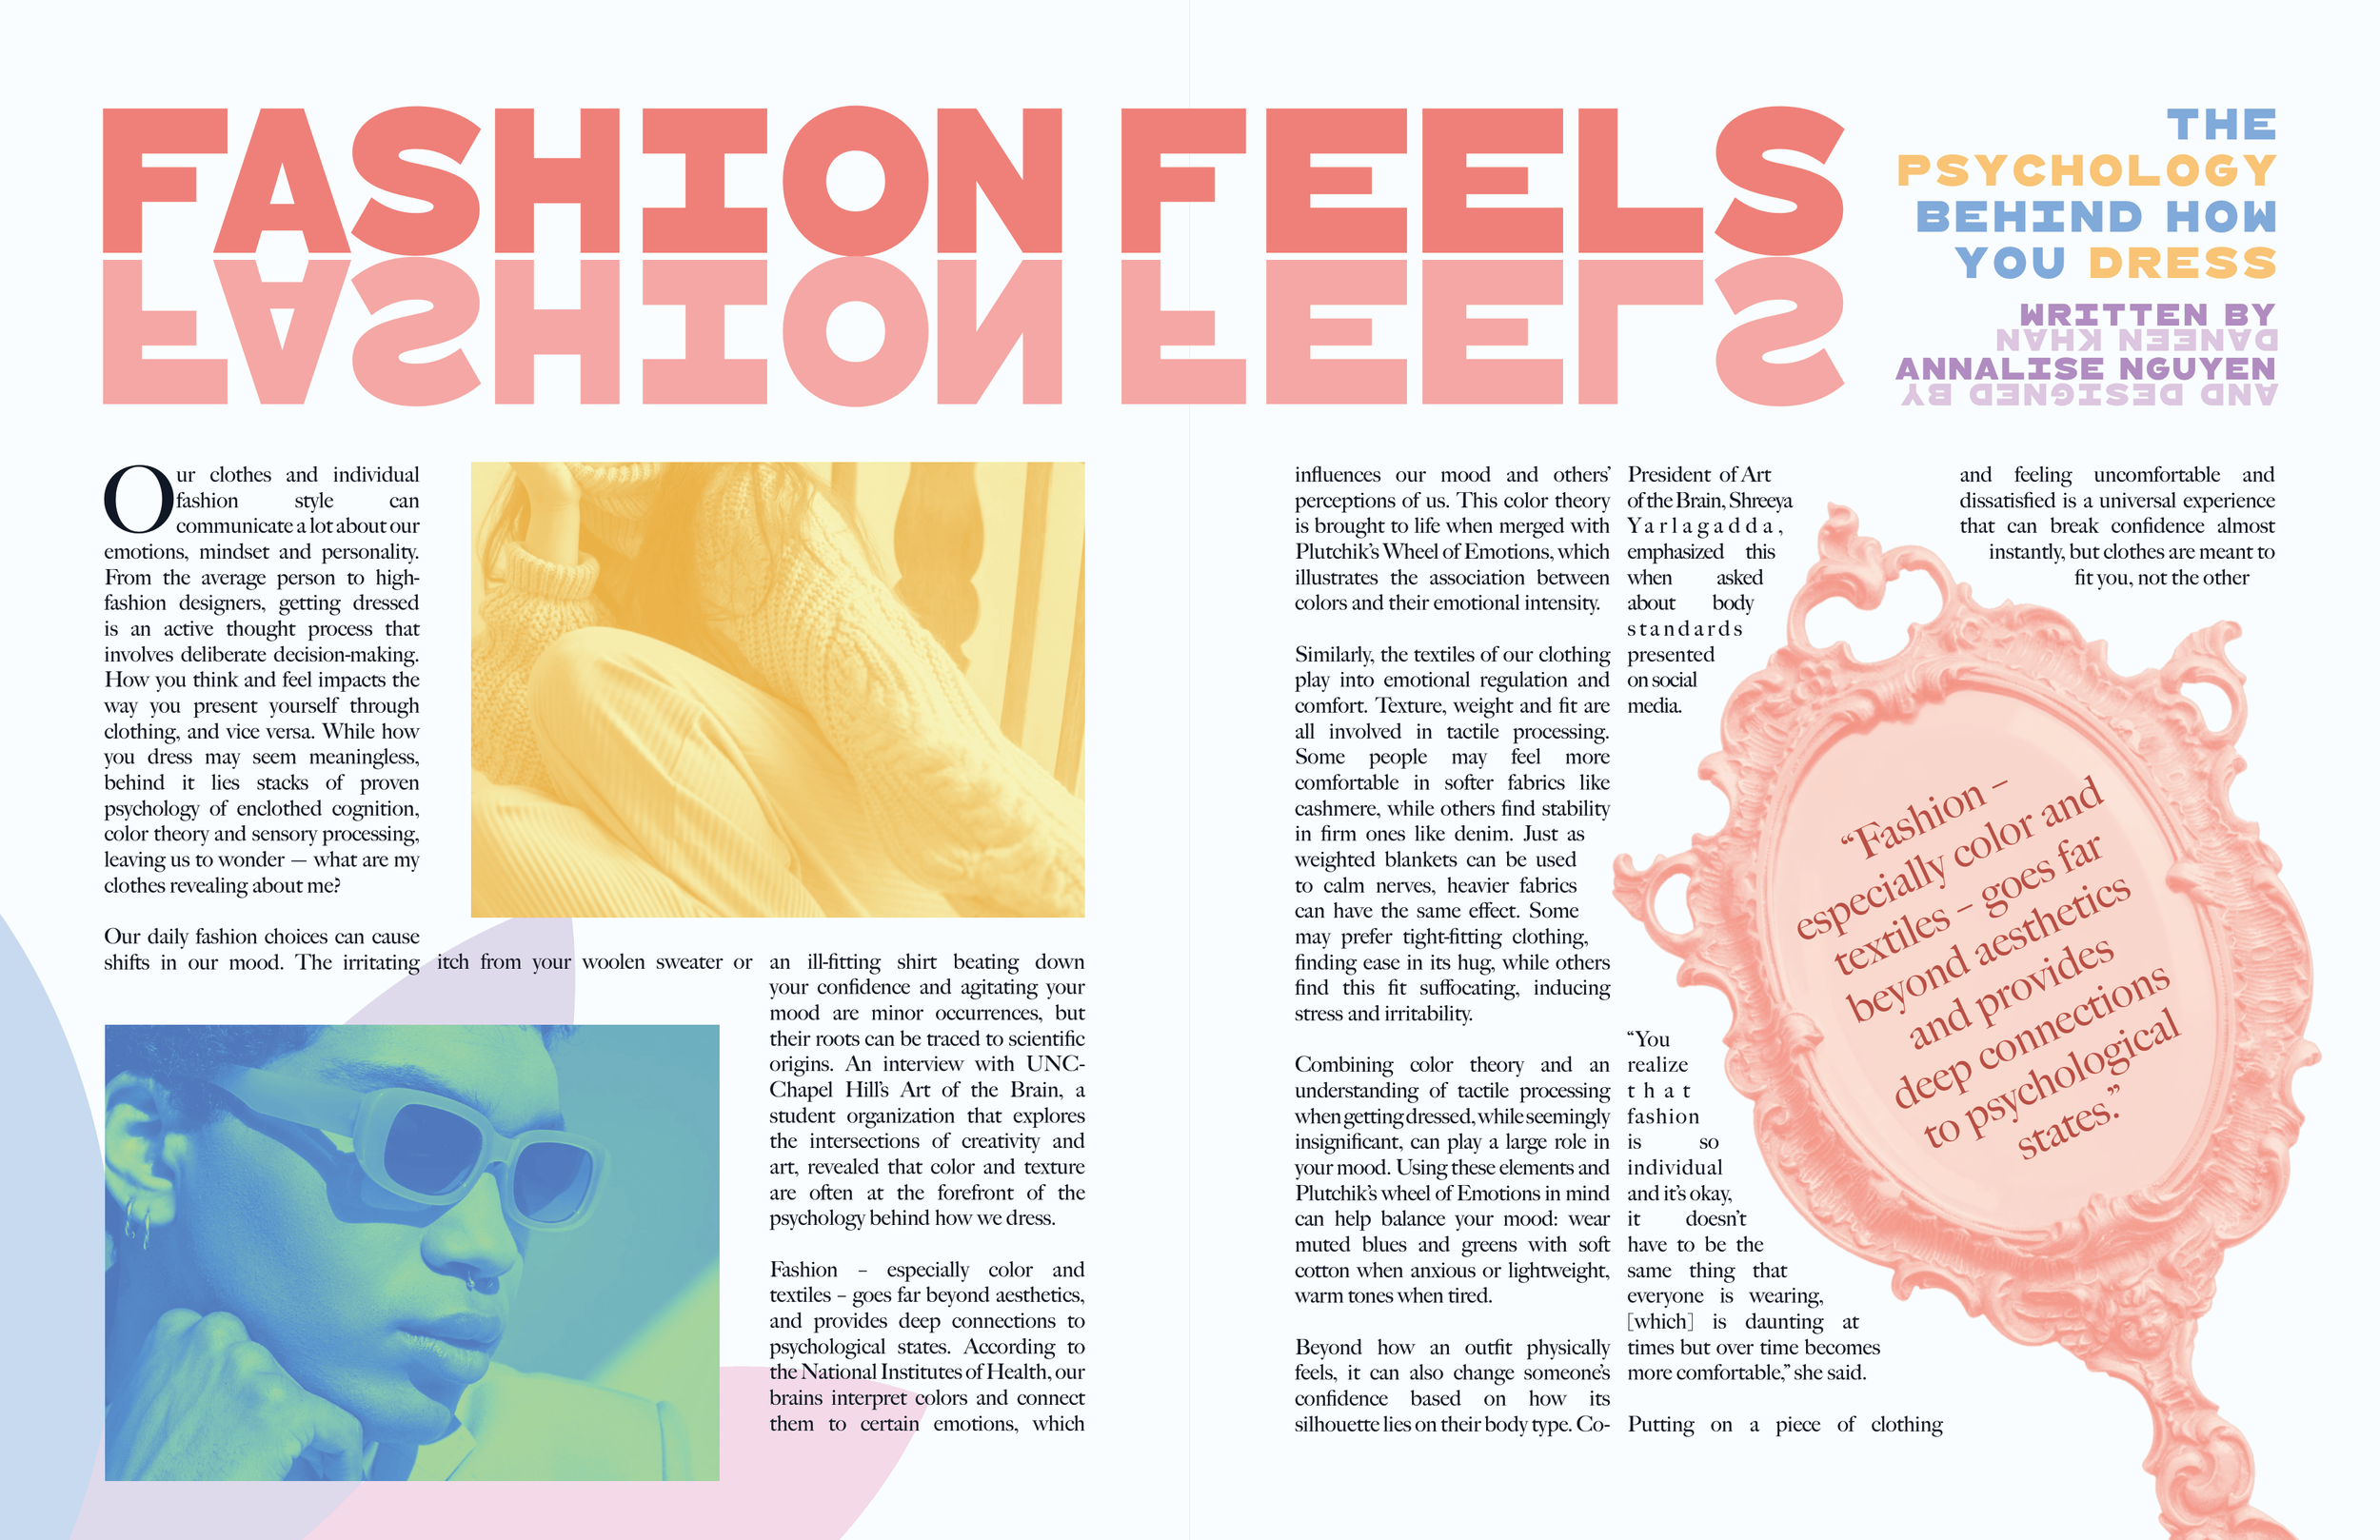
Fashion Feels: As a graphic designer for Coulture Magazine, I created multiple spreads for print production. This was about psychology in style.

Spotify Redesign: Another class project, this assignment required me to redesign a popular music app for a 60+ age demographic. Click through the prototype at the link.
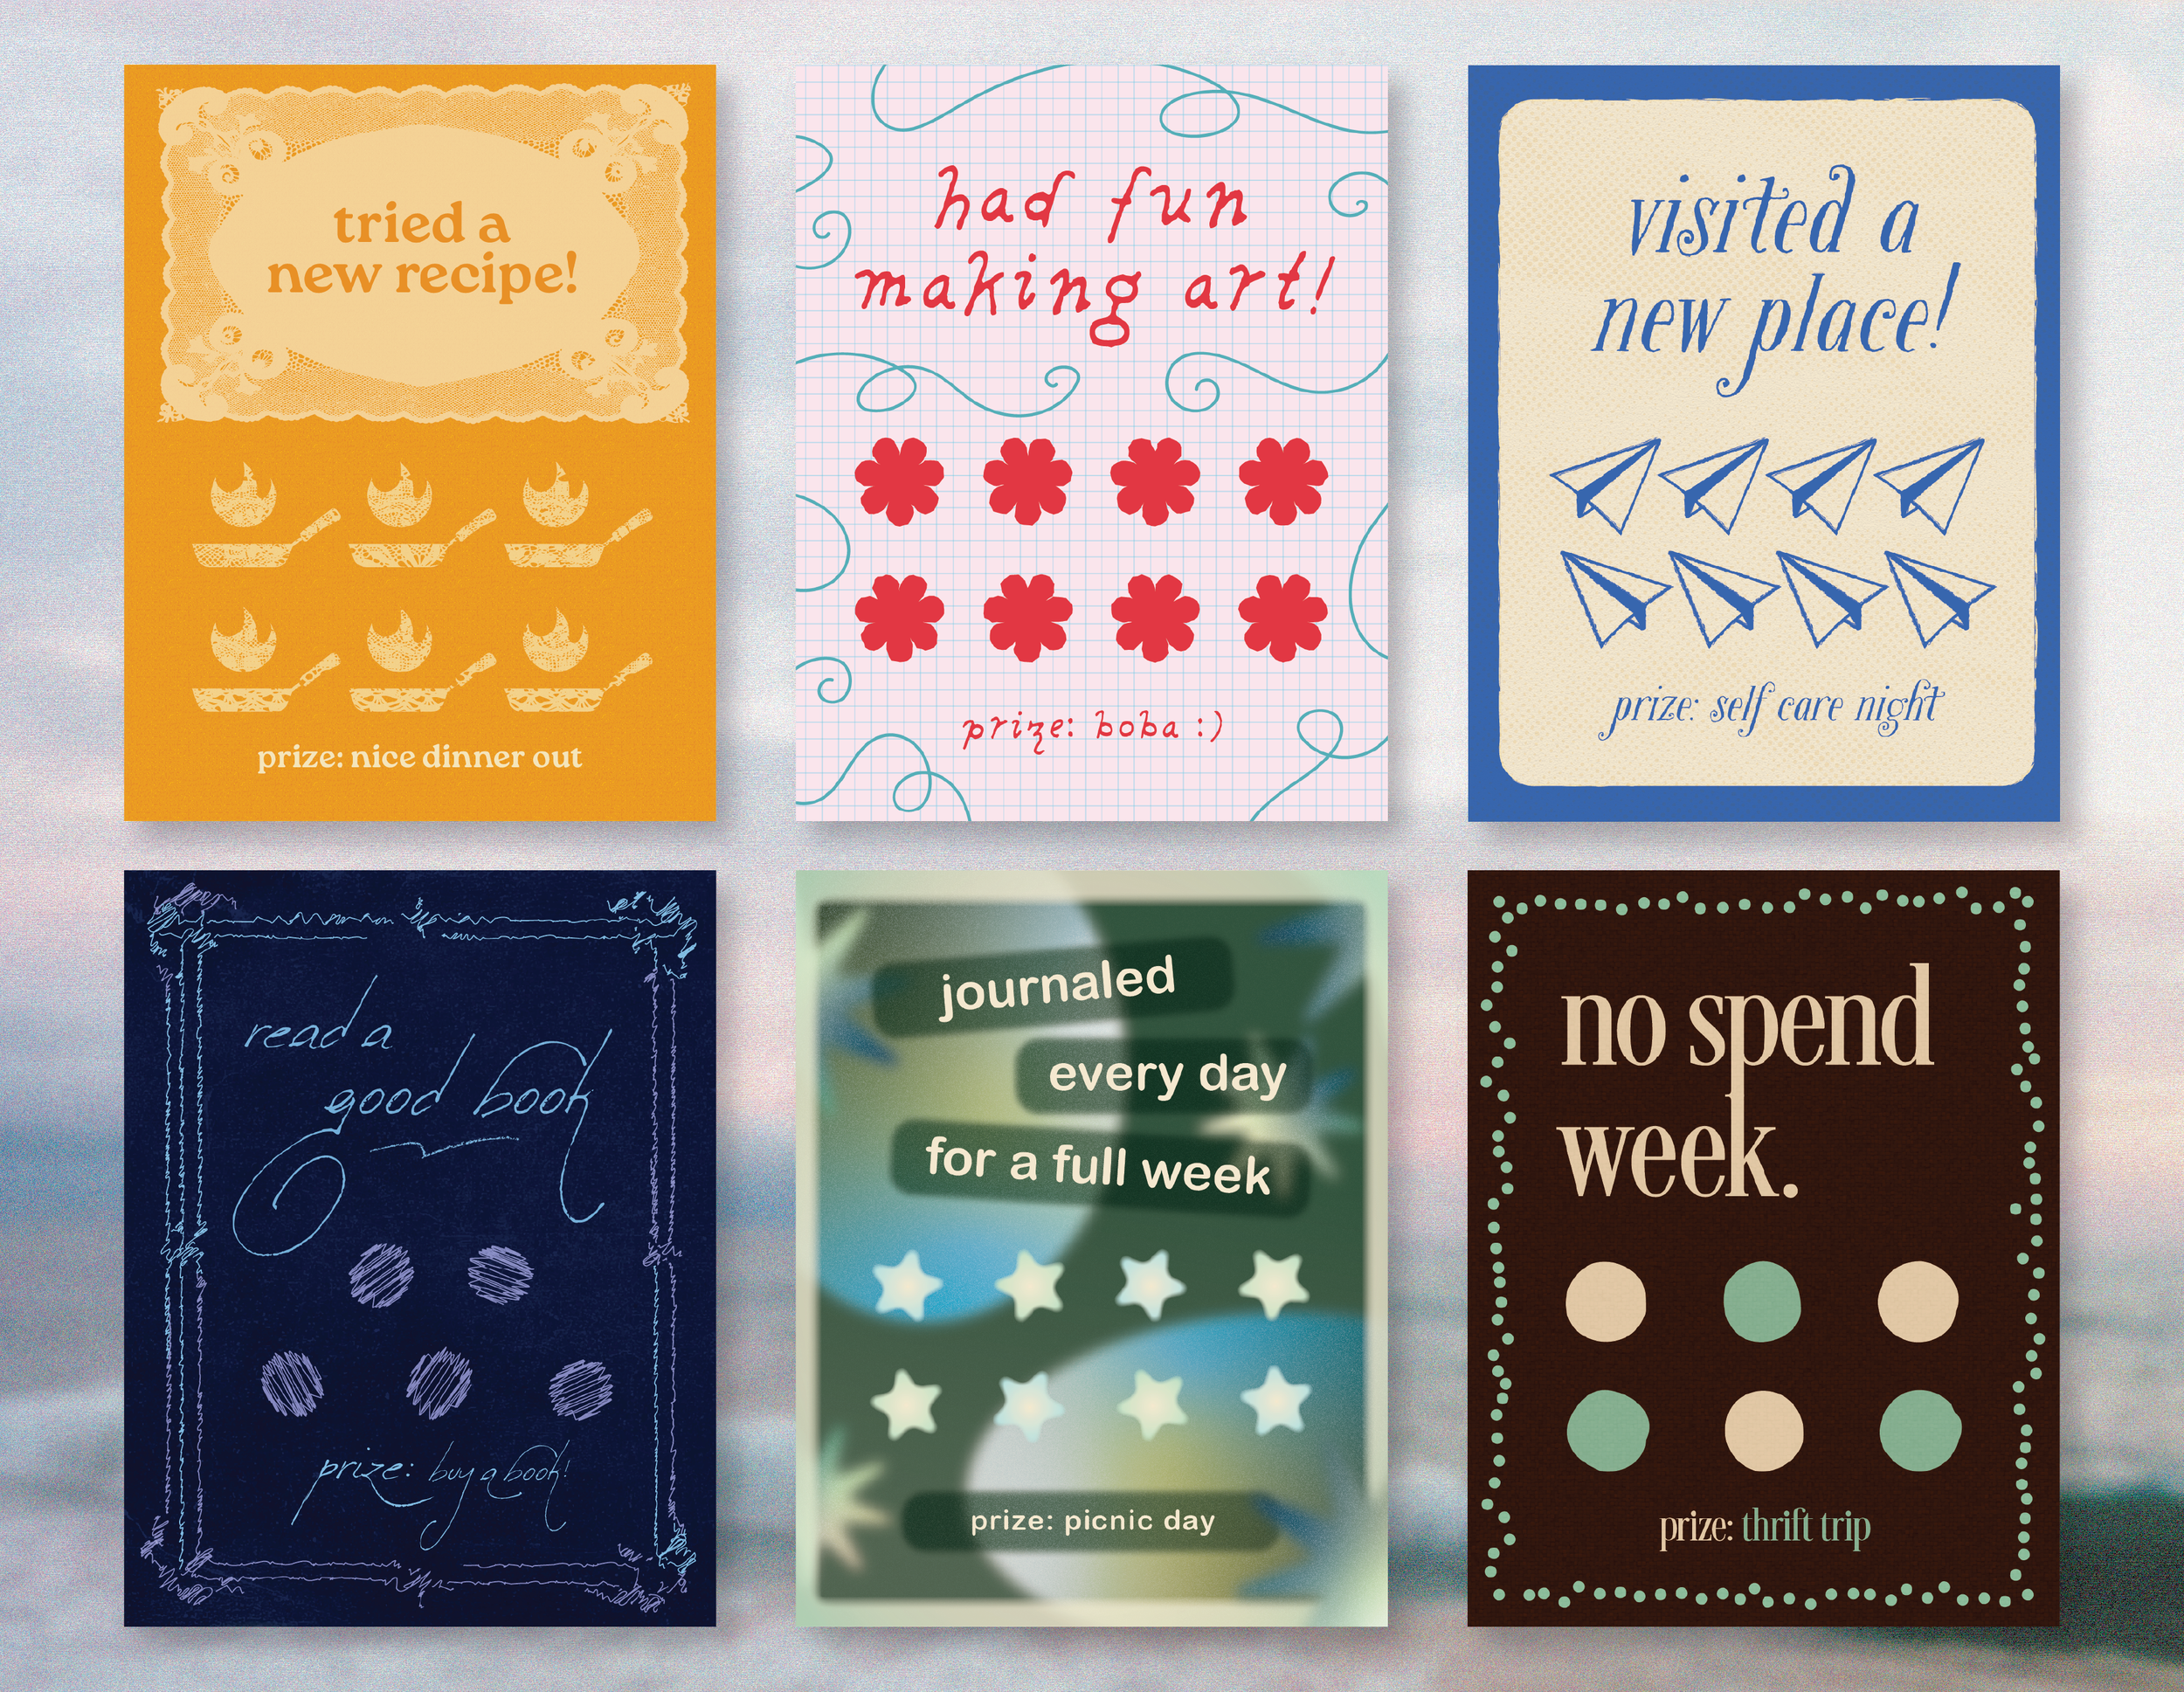
Punch Cards: When the "personal punch card" trend was trending online, I made my own batch to experiment with different design styles.